Zip Codes with the Highest Percentage of Population with a Degree in Visual and Performing Arts in Tucson, AZ
RELATED REPORTS & OPTIONS
Visual and Performing Arts
Tucson
Compare Zip Codes
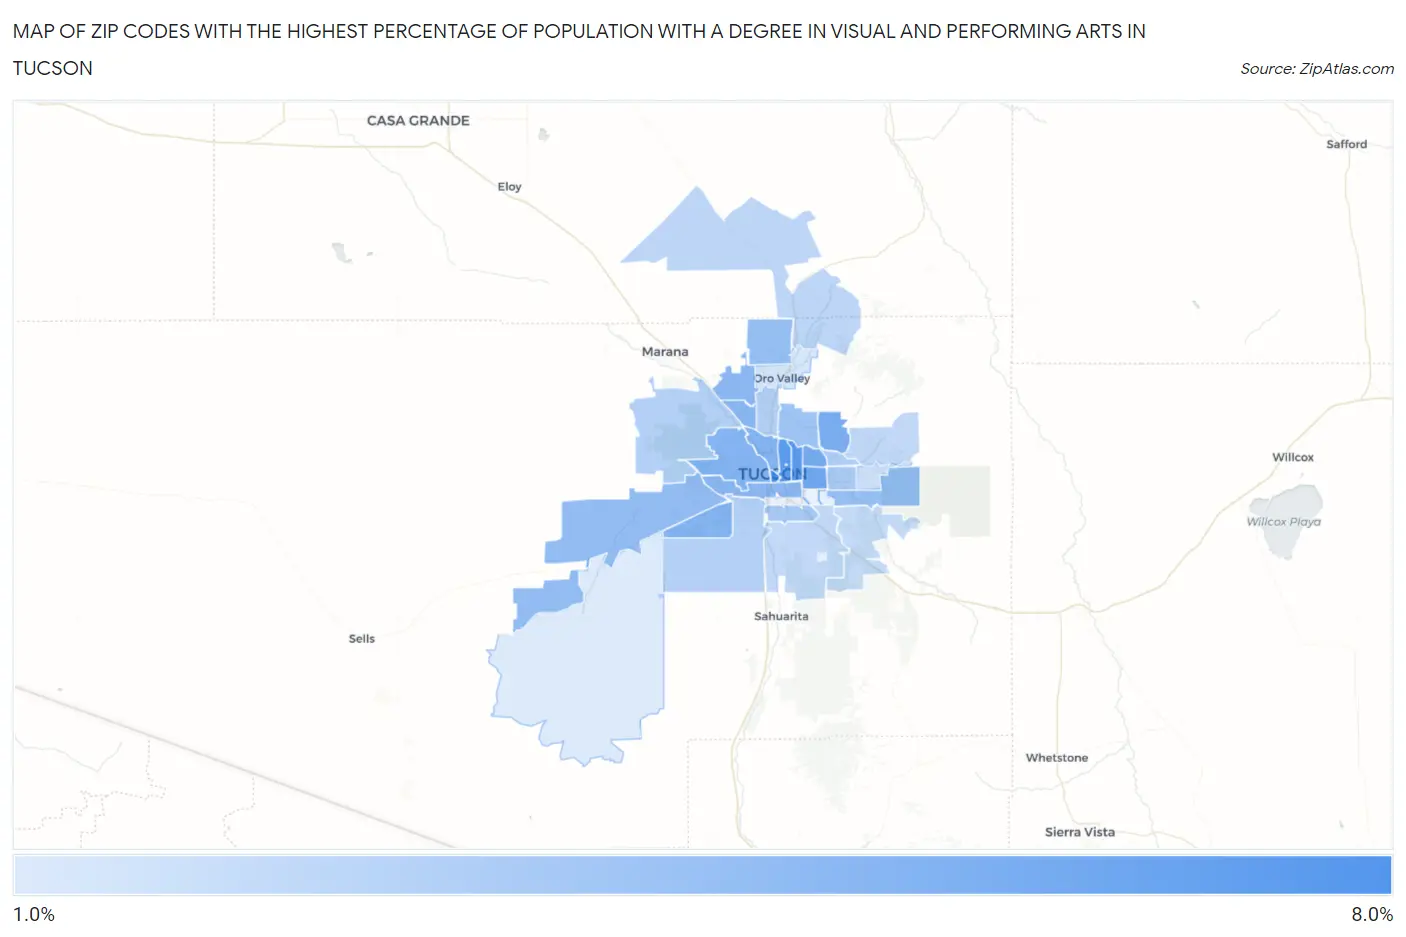
Map of Zip Codes with the Highest Percentage of Population with a Degree in Visual and Performing Arts in Tucson
1.8%
7.3%
Zip Codes with the Highest Percentage of Population with a Degree in Visual and Performing Arts in Tucson, AZ
| Zip Code | % Graduates | vs State | vs National | |
| 1. | 85701 | 7.3% | 3.6%(+3.72)#26 | 4.3%(+3.04)#3,376 |
| 2. | 85716 | 6.7% | 3.6%(+3.11)#36 | 4.3%(+2.43)#4,005 |
| 3. | 85719 | 6.5% | 3.6%(+2.93)#42 | 4.3%(+2.25)#4,221 |
| 4. | 85711 | 5.7% | 3.6%(+2.14)#58 | 4.3%(+1.46)#5,314 |
| 5. | 85712 | 5.6% | 3.6%(+2.02)#61 | 4.3%(+1.35)#5,505 |
| 6. | 85750 | 5.4% | 3.6%(+1.86)#65 | 4.3%(+1.19)#5,781 |
| 7. | 85757 | 5.1% | 3.6%(+1.48)#71 | 4.3%(+0.798)#6,523 |
| 8. | 85745 | 5.0% | 3.6%(+1.42)#75 | 4.3%(+0.739)#6,672 |
| 9. | 85705 | 4.9% | 3.6%(+1.36)#78 | 4.3%(+0.683)#6,794 |
| 10. | 85741 | 4.8% | 3.6%(+1.25)#81 | 4.3%(+0.574)#7,016 |
| 11. | 85713 | 4.8% | 3.6%(+1.18)#84 | 4.3%(+0.501)#7,185 |
| 12. | 85742 | 4.7% | 3.6%(+1.17)#85 | 4.3%(+0.488)#7,218 |
| 13. | 85735 | 4.5% | 3.6%(+0.880)#95 | 4.3%(+0.203)#7,927 |
| 14. | 85755 | 4.4% | 3.6%(+0.803)#100 | 4.3%(+0.126)#8,147 |
| 15. | 85730 | 4.3% | 3.6%(+0.741)#104 | 4.3%(+0.064)#8,309 |
| 16. | 85718 | 4.0% | 3.6%(+0.453)#116 | 4.3%(-0.224)#9,166 |
| 17. | 85706 | 3.8% | 3.6%(+0.239)#121 | 4.3%(-0.438)#9,823 |
| 18. | 85710 | 3.7% | 3.6%(+0.166)#124 | 4.3%(-0.511)#10,026 |
| 19. | 85715 | 3.3% | 3.6%(-0.232)#141 | 4.3%(-0.910)#11,446 |
| 20. | 85704 | 3.3% | 3.6%(-0.266)#145 | 4.3%(-0.944)#11,581 |
| 21. | 85746 | 3.3% | 3.6%(-0.282)#147 | 4.3%(-0.959)#11,637 |
| 22. | 85743 | 3.3% | 3.6%(-0.308)#149 | 4.3%(-0.986)#11,733 |
| 23. | 85739 | 3.0% | 3.6%(-0.601)#173 | 4.3%(-1.28)#12,824 |
| 24. | 85749 | 2.8% | 3.6%(-0.755)#183 | 4.3%(-1.43)#13,409 |
| 25. | 85756 | 2.8% | 3.6%(-0.803)#188 | 4.3%(-1.48)#13,604 |
| 26. | 85747 | 2.7% | 3.6%(-0.857)#191 | 4.3%(-1.53)#13,828 |
| 27. | 85748 | 2.3% | 3.6%(-1.23)#210 | 4.3%(-1.91)#15,186 |
| 28. | 85737 | 2.1% | 3.6%(-1.50)#219 | 4.3%(-2.18)#16,176 |
| 29. | 85736 | 1.8% | 3.6%(-1.79)#236 | 4.3%(-2.47)#17,188 |
1
Common Questions
What are the Top 10 Zip Codes with the Highest Percentage of Population with a Degree in Visual and Performing Arts in Tucson, AZ?
Top 10 Zip Codes with the Highest Percentage of Population with a Degree in Visual and Performing Arts in Tucson, AZ are:
What zip code has the Highest Percentage of Population with a Degree in Visual and Performing Arts in Tucson, AZ?
85701 has the Highest Percentage of Population with a Degree in Visual and Performing Arts in Tucson, AZ with 7.3%.
What is the Percentage of Population with a Degree in Visual and Performing Arts in Tucson, AZ?
Percentage of Population with a Degree in Visual and Performing Arts in Tucson is 4.8%.
What is the Percentage of Population with a Degree in Visual and Performing Arts in Arizona?
Percentage of Population with a Degree in Visual and Performing Arts in Arizona is 3.6%.
What is the Percentage of Population with a Degree in Visual and Performing Arts in the United States?
Percentage of Population with a Degree in Visual and Performing Arts in the United States is 4.3%.