Zip Codes with the Highest Percentage of Population Employed in Real Estate, Rental & Leasing in Tucson, AZ
RELATED REPORTS & OPTIONS
Real Estate, Rental & Leasing
Tucson
Compare Zip Codes
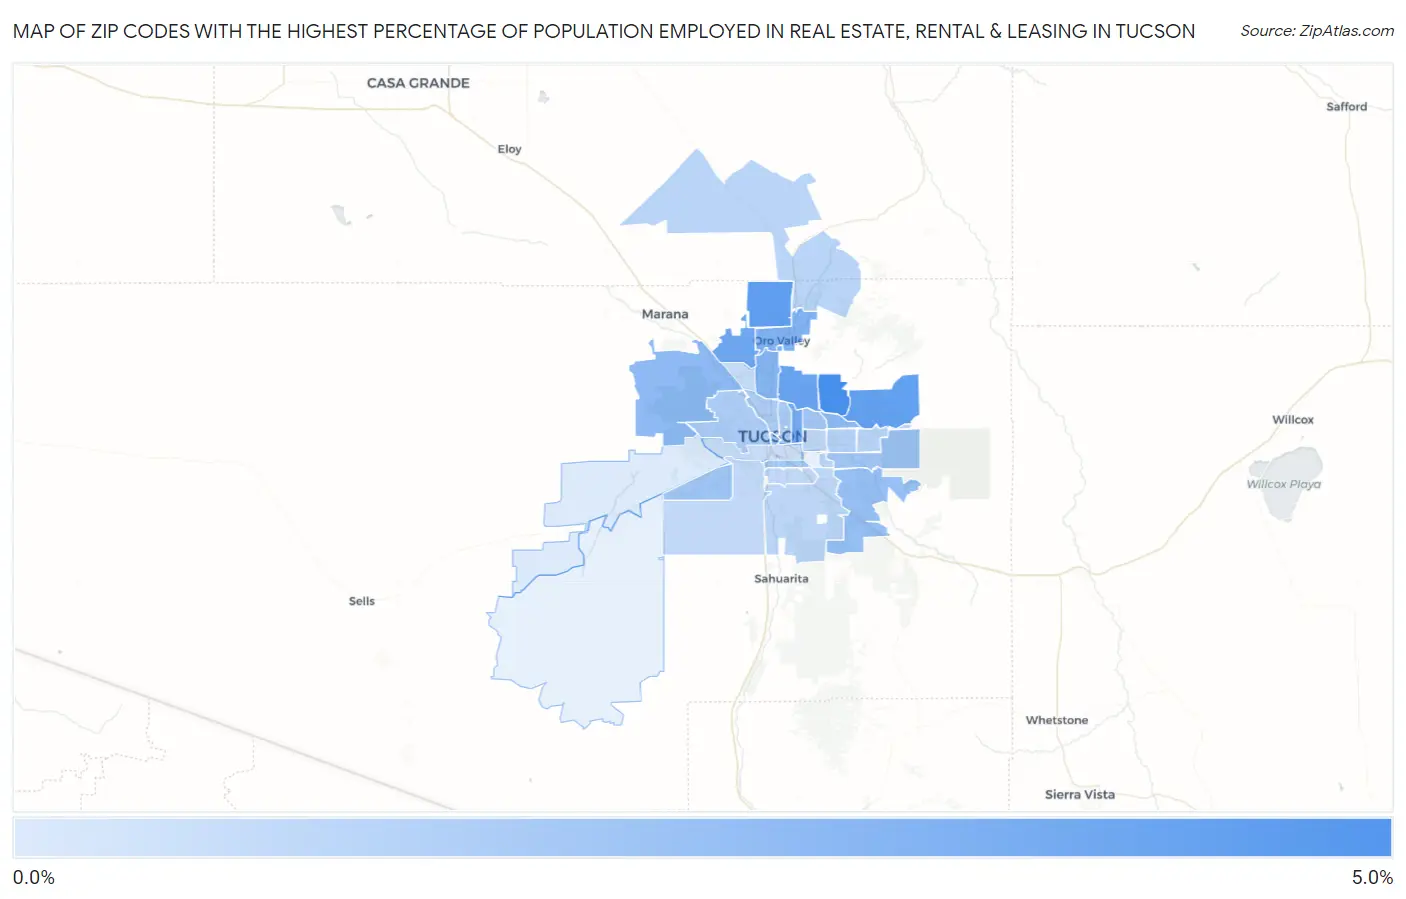
Map of Zip Codes with the Highest Percentage of Population Employed in Real Estate, Rental & Leasing in Tucson
0.61%
4.7%
Zip Codes with the Highest Percentage of Population Employed in Real Estate, Rental & Leasing in Tucson, AZ
| Zip Code | % Employed | vs State | vs National | |
| 1. | 85750 | 4.7% | 2.4%(+2.29)#29 | 1.9%(+2.81)#1,567 |
| 2. | 85755 | 4.0% | 2.4%(+1.61)#44 | 1.9%(+2.13)#2,146 |
| 3. | 85749 | 3.9% | 2.4%(+1.51)#46 | 1.9%(+2.02)#2,270 |
| 4. | 85718 | 3.8% | 2.4%(+1.39)#51 | 1.9%(+1.91)#2,390 |
| 5. | 85742 | 3.6% | 2.4%(+1.18)#61 | 1.9%(+1.70)#2,689 |
| 6. | 85716 | 3.5% | 2.4%(+1.08)#68 | 1.9%(+1.60)#2,862 |
| 7. | 85737 | 3.1% | 2.4%(+0.683)#88 | 1.9%(+1.20)#3,659 |
| 8. | 85704 | 3.0% | 2.4%(+0.581)#91 | 1.9%(+1.09)#3,948 |
| 9. | 85715 | 2.8% | 2.4%(+0.350)#105 | 1.9%(+0.862)#4,566 |
| 10. | 85743 | 2.8% | 2.4%(+0.349)#106 | 1.9%(+0.861)#4,570 |
| 11. | 85747 | 2.5% | 2.4%(+0.071)#133 | 1.9%(+0.583)#5,578 |
| 12. | 85701 | 2.3% | 2.4%(-0.123)#144 | 1.9%(+0.389)#6,401 |
| 13. | 85757 | 2.3% | 2.4%(-0.128)#146 | 1.9%(+0.385)#6,419 |
| 14. | 85712 | 2.2% | 2.4%(-0.163)#148 | 1.9%(+0.349)#6,612 |
| 15. | 85730 | 2.2% | 2.4%(-0.205)#154 | 1.9%(+0.307)#6,819 |
| 16. | 85714 | 2.0% | 2.4%(-0.376)#173 | 1.9%(+0.137)#7,696 |
| 17. | 85719 | 2.0% | 2.4%(-0.392)#174 | 1.9%(+0.121)#7,769 |
| 18. | 85745 | 1.9% | 2.4%(-0.501)#183 | 1.9%(+0.012)#8,441 |
| 19. | 85705 | 1.9% | 2.4%(-0.514)#186 | 1.9%(-0.001)#8,537 |
| 20. | 85710 | 1.7% | 2.4%(-0.706)#201 | 1.9%(-0.193)#9,763 |
| 21. | 85748 | 1.6% | 2.4%(-0.771)#211 | 1.9%(-0.259)#10,223 |
| 22. | 85708 | 1.6% | 2.4%(-0.815)#218 | 1.9%(-0.302)#10,523 |
| 23. | 85739 | 1.5% | 2.4%(-0.856)#220 | 1.9%(-0.344)#10,801 |
| 24. | 85756 | 1.5% | 2.4%(-0.953)#232 | 1.9%(-0.441)#11,569 |
| 25. | 85711 | 1.4% | 2.4%(-0.965)#233 | 1.9%(-0.452)#11,659 |
| 26. | 85706 | 1.4% | 2.4%(-1.03)#240 | 1.9%(-0.520)#12,197 |
| 27. | 85746 | 1.3% | 2.4%(-1.06)#245 | 1.9%(-0.549)#12,399 |
| 28. | 85741 | 1.2% | 2.4%(-1.19)#255 | 1.9%(-0.680)#13,393 |
| 29. | 85713 | 1.1% | 2.4%(-1.31)#263 | 1.9%(-0.801)#14,374 |
| 30. | 85735 | 0.61% | 2.4%(-1.79)#278 | 1.9%(-1.28)#18,158 |
1
Common Questions
What are the Top 10 Zip Codes with the Highest Percentage of Population Employed in Real Estate, Rental & Leasing in Tucson, AZ?
Top 10 Zip Codes with the Highest Percentage of Population Employed in Real Estate, Rental & Leasing in Tucson, AZ are:
What zip code has the Highest Percentage of Population Employed in Real Estate, Rental & Leasing in Tucson, AZ?
85750 has the Highest Percentage of Population Employed in Real Estate, Rental & Leasing in Tucson, AZ with 4.7%.
What is the Percentage of Population Employed in Real Estate, Rental & Leasing in Tucson, AZ?
Percentage of Population Employed in Real Estate, Rental & Leasing in Tucson is 1.8%.
What is the Percentage of Population Employed in Real Estate, Rental & Leasing in Arizona?
Percentage of Population Employed in Real Estate, Rental & Leasing in Arizona is 2.4%.
What is the Percentage of Population Employed in Real Estate, Rental & Leasing in the United States?
Percentage of Population Employed in Real Estate, Rental & Leasing in the United States is 1.9%.