Area Code 907 Map & Demographics
Area Code 907 Map
Area Code 907 Overview
$33,313
PER CAPITA INCOME
$77,010
AVG FAMILY INCOME
$64,271
AVG HOUSEHOLD INCOME
29.9%
WAGE / INCOME GAP [ % ]
70.1¢/ $1
WAGE / INCOME GAP [ $ ]
$11,444
FAMILY INCOME DEFICIT
92.81
INEQUALITY / GINI INDEX
734,264
TOTAL POPULATION
386,162
MALE POPULATION
348,102
FEMALE POPULATION
110.93
MALES / 100 FEMALES
90.14
FEMALES / 100 MALES
36.5
MEDIAN AGE
3.7
AVG FAMILY SIZE
3.1
AVG HOUSEHOLD SIZE
362,016
LABOR FORCE [ PEOPLE ]
63.1%
PERCENT IN LABOR FORCE
15.3%
UNEMPLOYMENT RATE
Nearby Area Codes
Income in Area Code 907
Income Overview in Area Code 907
Per Capita Income in Area Code 907 is $33,313, while median incomes of families and households are $77,010 and $64,271 respectively.
| Characteristic | Number | Measure |
| Per Capita Income | 734,264 | $33,313 |
| Median Family Income | 170,957 | $77,010 |
| Mean Family Income | 170,957 | $19,029,645 |
| Median Household Income | 264,362 | $64,271 |
| Mean Household Income | 264,362 | $17,811,982 |
| Income Deficit | 170,957 | $11,444 |
| Wage / Income Gap (%) | 734,264 | 29.93% |
| Wage / Income Gap ($) | 734,264 | 70.07¢ per $1 |
| Gini / Inequality Index | 734,264 | 92.81 |
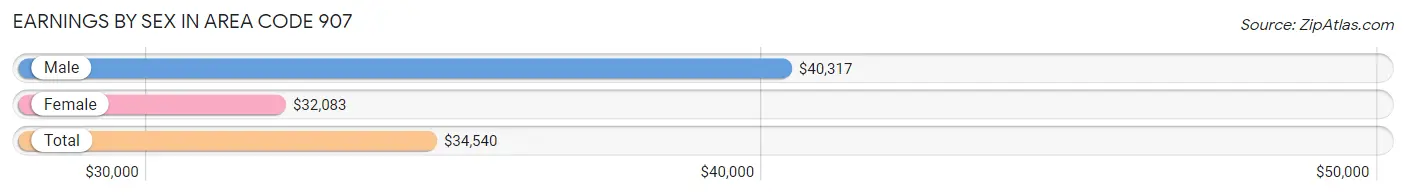
Earnings by Sex in Area Code 907
Average Earnings in Area Code 907 are $34,540, $40,317 for men and $32,083 for women, a difference of 20.4%.
| Sex | Number | Average Earnings |
| Male | 227,566 (56.0%) | $40,317 |
| Female | 179,097 (44.0%) | $32,083 |
| Total | 406,663 (100.0%) | $34,540 |
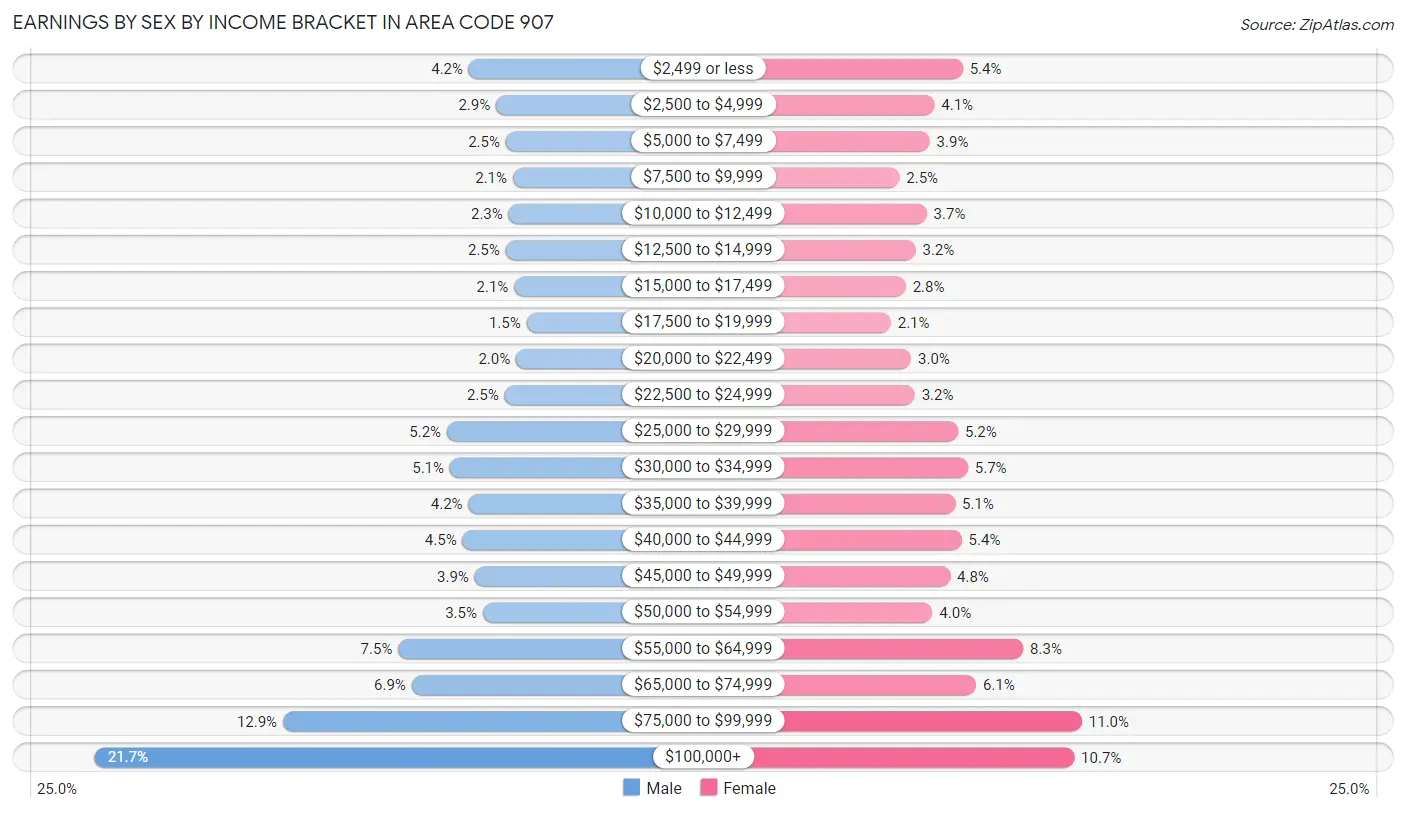
Earnings by Sex by Income Bracket in Area Code 907
The most common earnings brackets in Area Code 907 are $100,000+ for men (49,408 | 21.7%) and $75,000 to $99,999 for women (19,715 | 11.0%).
| Income | Male | Female |
| $2,499 or less | 9,537 (4.2%) | 9,729 (5.4%) |
| $2,500 to $4,999 | 6,634 (2.9%) | 7,342 (4.1%) |
| $5,000 to $7,499 | 5,590 (2.5%) | 6,947 (3.9%) |
| $7,500 to $9,999 | 4,842 (2.1%) | 4,409 (2.5%) |
| $10,000 to $12,499 | 5,296 (2.3%) | 6,698 (3.7%) |
| $12,500 to $14,999 | 5,631 (2.5%) | 5,769 (3.2%) |
| $15,000 to $17,499 | 4,721 (2.1%) | 4,948 (2.8%) |
| $17,500 to $19,999 | 3,401 (1.5%) | 3,683 (2.1%) |
| $20,000 to $22,499 | 4,510 (2.0%) | 5,397 (3.0%) |
| $22,500 to $24,999 | 5,733 (2.5%) | 5,688 (3.2%) |
| $25,000 to $29,999 | 11,872 (5.2%) | 9,327 (5.2%) |
| $30,000 to $34,999 | 11,551 (5.1%) | 10,157 (5.7%) |
| $35,000 to $39,999 | 9,584 (4.2%) | 9,085 (5.1%) |
| $40,000 to $44,999 | 10,212 (4.5%) | 9,644 (5.4%) |
| $45,000 to $49,999 | 8,920 (3.9%) | 8,669 (4.8%) |
| $50,000 to $54,999 | 8,055 (3.5%) | 7,178 (4.0%) |
| $55,000 to $64,999 | 17,075 (7.5%) | 14,798 (8.3%) |
| $65,000 to $74,999 | 15,643 (6.9%) | 10,843 (6.0%) |
| $75,000 to $99,999 | 29,351 (12.9%) | 19,715 (11.0%) |
| $100,000+ | 49,408 (21.7%) | 19,071 (10.6%) |
| Total | 227,566 (100.0%) | 179,097 (100.0%) |
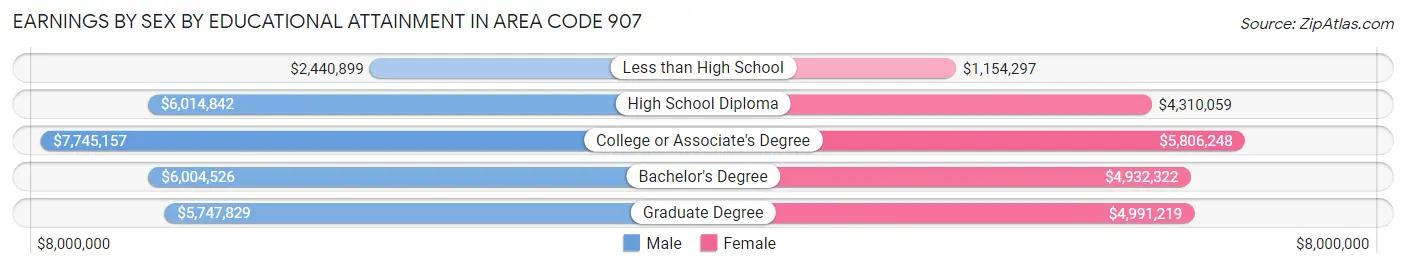
Earnings by Sex by Educational Attainment in Area Code 907
Average earnings in Area Code 907 are $8,166,718 for men and $6,457,684 for women, a difference of 20.9%. Men with an educational attainment of college or associate's degree enjoy the highest average annual earnings of $7,745,157, while those with less than high school education earn the least with $2,440,899. Women with an educational attainment of college or associate's degree earn the most with the average annual earnings of $5,806,248, while those with less than high school education have the smallest earnings of $1,154,297.
| Educational Attainment | Male Income | Female Income |
| Less than High School | $2,440,899 | $1,154,297 |
| High School Diploma | $6,014,842 | $4,310,059 |
| College or Associate's Degree | $7,745,157 | $5,806,248 |
| Bachelor's Degree | $6,004,526 | $4,932,322 |
| Graduate Degree | $5,747,829 | $4,991,219 |
| Total | $8,166,718 | $6,457,684 |
Family Income in Area Code 907
Family Income Brackets in Area Code 907
According to the Area Code 907 family income data, there are 6,762,204 families falling into the $50,000 to $74,999 income range, which is the most common income bracket and makes up 3,955.5% of all families. Conversely, the $10,000 to $14,999 income bracket is the least frequent group with only 1,131,735 families (662.0%) belonging to this category.
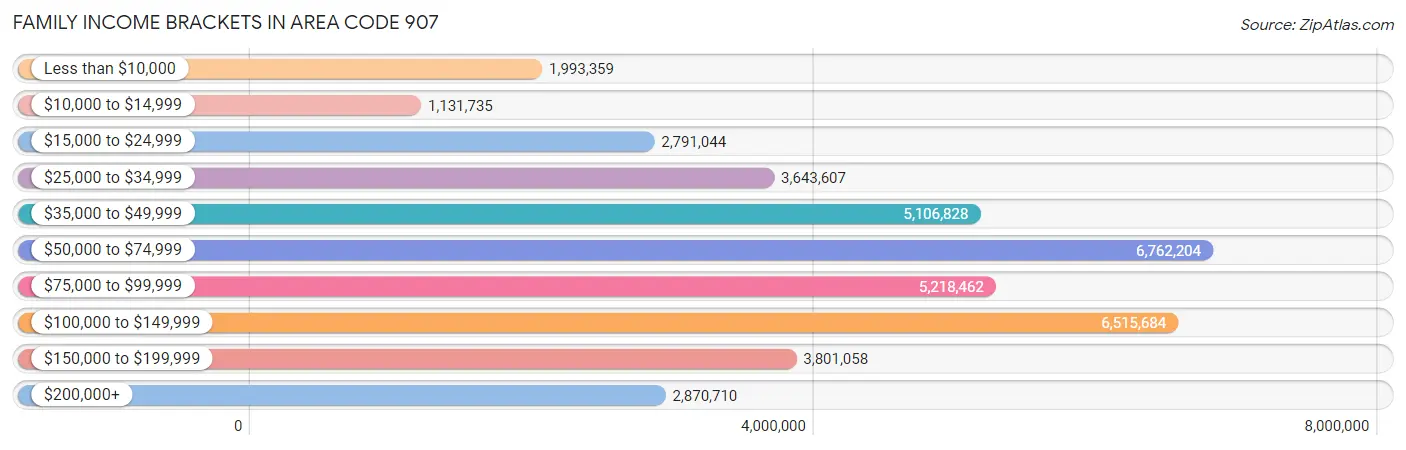
| Income Bracket | # Families | % Families |
| Less than $10,000 | 1,993,359 | 1,166.0% |
| $10,000 to $14,999 | 1,131,735 | 662.0% |
| $15,000 to $24,999 | 2,791,044 | 1,632.6% |
| $25,000 to $34,999 | 3,643,607 | 2,131.3% |
| $35,000 to $49,999 | 5,106,828 | 2,987.2% |
| $50,000 to $74,999 | 6,762,204 | 3,955.5% |
| $75,000 to $99,999 | 5,218,462 | 3,052.5% |
| $100,000 to $149,999 | 6,515,684 | 3,811.3% |
| $150,000 to $199,999 | 3,801,058 | 2,223.4% |
| $200,000+ | 2,870,710 | 1,679.2% |
Family Income by Famaliy Size in Area Code 907
6-person families (6,716 | 3.9%) account for the highest median family income in Area Code 907 with $103,746 per family, while 2-person families (77,871 | 45.6%) have the highest median income of $35,742 per family member.
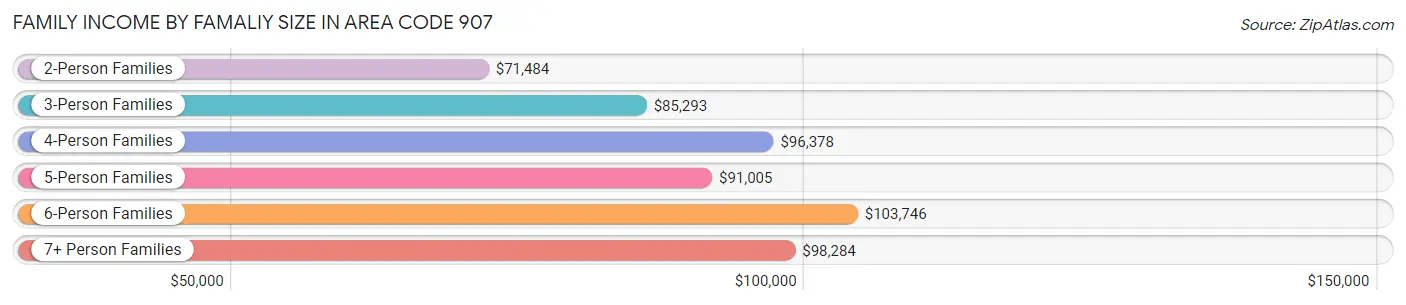
| Income Bracket | # Families | Median Income |
| 2-Person Families | 77,871 (45.6%) | $71,484 |
| 3-Person Families | 35,284 (20.6%) | $85,293 |
| 4-Person Families | 30,400 (17.8%) | $96,378 |
| 5-Person Families | 15,430 (9.0%) | $91,005 |
| 6-Person Families | 6,716 (3.9%) | $103,746 |
| 7+ Person Families | 5,256 (3.1%) | $98,284 |
| Total | 170,957 (100.0%) | $77,010 |
Family Income by Number of Earners in Area Code 907
The median family income in Area Code 907 is $77,010, with families comprising 3+ earners (20,090) having the highest median family income of $137,518, while families with no earners (20,920) have the lowest median family income of $48,382, accounting for 11.7% and 12.2% of families, respectively.
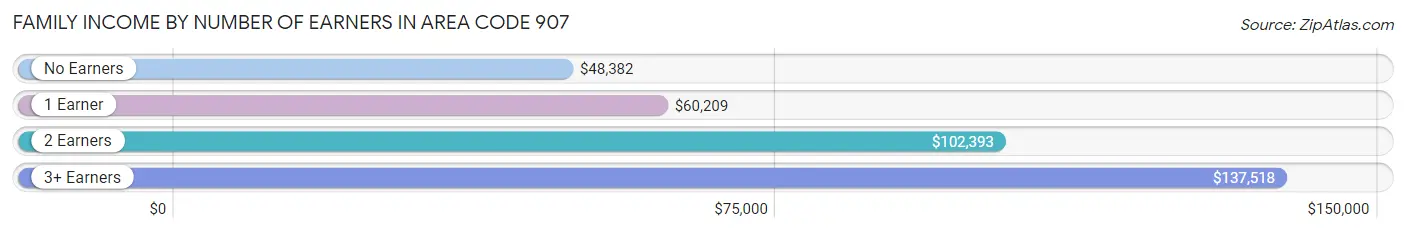
| Number of Earners | # Families | Median Income |
| No Earners | 20,920 (12.2%) | $48,382 |
| 1 Earner | 54,022 (31.6%) | $60,209 |
| 2 Earners | 75,925 (44.4%) | $102,393 |
| 3+ Earners | 20,090 (11.7%) | $137,518 |
| Total | 170,957 (100.0%) | $77,010 |
Household Income in Area Code 907
Household Income Brackets in Area Code 907
With 10,520,021 households falling in the category, the $50,000 to $74,999 income range is the most frequent in Area Code 907, accounting for 3,979.4% of all households. In contrast, only 2,453,015 households (927.9%) fall into the $10,000 to $14,999 income bracket, making it the least populous group.
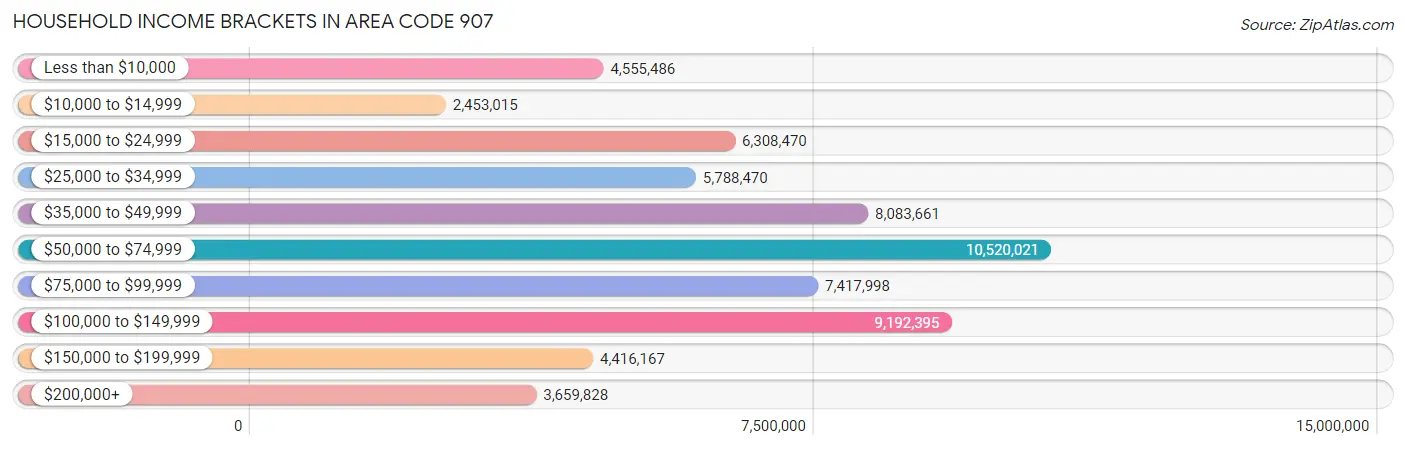
| Income Bracket | # Households | % Households |
| Less than $10,000 | 4,555,486 | 1,723.2% |
| $10,000 to $14,999 | 2,453,015 | 927.9% |
| $15,000 to $24,999 | 6,308,470 | 2,386.3% |
| $25,000 to $34,999 | 5,788,470 | 2,189.6% |
| $35,000 to $49,999 | 8,083,661 | 3,057.8% |
| $50,000 to $74,999 | 10,520,021 | 3,979.4% |
| $75,000 to $99,999 | 7,417,998 | 2,806.0% |
| $100,000 to $149,999 | 9,192,395 | 3,477.2% |
| $150,000 to $199,999 | 4,416,167 | 1,670.5% |
| $200,000+ | 3,659,828 | 1,384.4% |
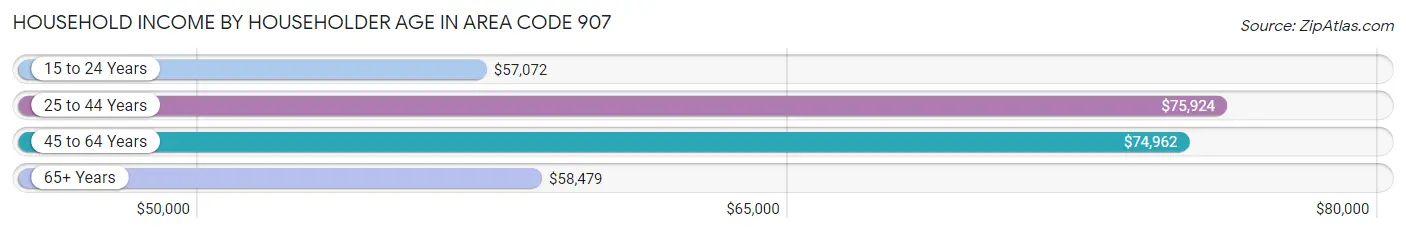
Household Income by Householder Age in Area Code 907
The median household income in Area Code 907 is $64,271, with the highest median household income of $75,924 found in the 25 to 44 years age bracket for the primary householder. A total of 95,964 households (36.3%) fall into this category. Meanwhile, the 15 to 24 years age bracket for the primary householder has the lowest median household income of $57,072, with 12,745 households (4.8%) in this group.
| Income Bracket | # Households | Median Income |
| 15 to 24 Years | 12,745 (4.8%) | $57,072 |
| 25 to 44 Years | 95,964 (36.3%) | $75,924 |
| 45 to 64 Years | 96,945 (36.7%) | $74,962 |
| 65+ Years | 58,708 (22.2%) | $58,479 |
| Total | 264,362 (100.0%) | $64,271 |
Poverty in Area Code 907
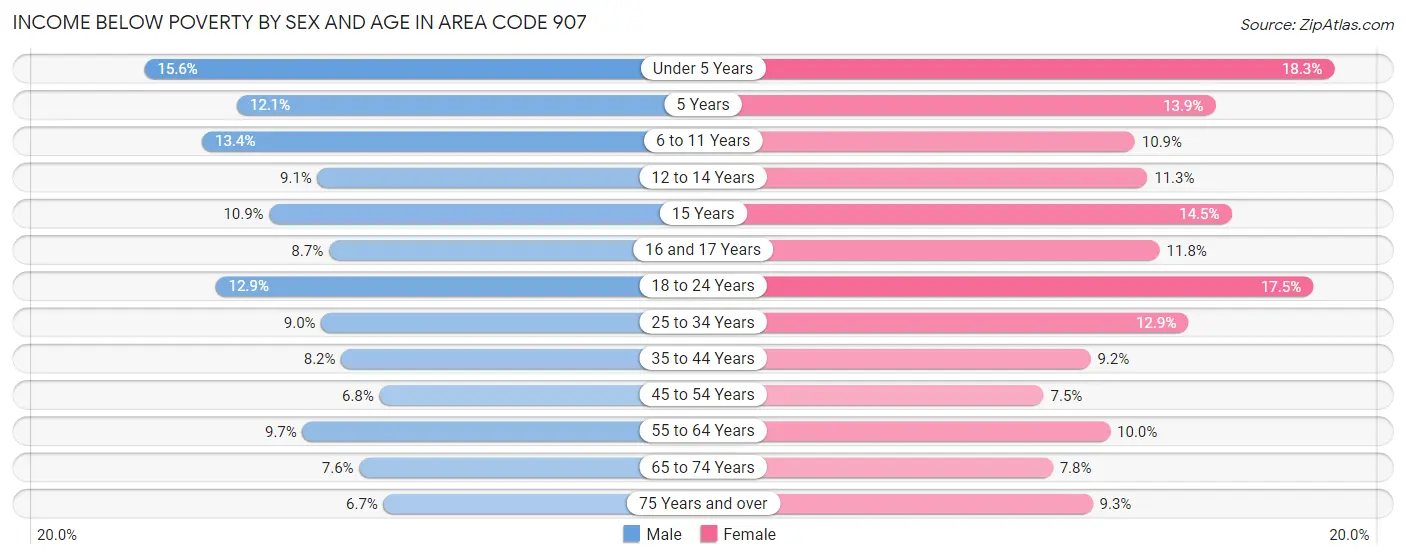
Income Below Poverty by Sex and Age in Area Code 907
With 9.7% poverty level for males and 11.3% for females among the residents of Area Code 907, under 5 year old males and under 5 year old females are the most vulnerable to poverty, with 3,842 males (15.5%) and 4,267 females (18.3%) in their respective age groups living below the poverty level.
| Age Bracket | Male | Female |
| Under 5 Years | 3,842 (15.5%) | 4,267 (18.3%) |
| 5 Years | 579 (12.1%) | 752 (13.9%) |
| 6 to 11 Years | 4,178 (13.4%) | 3,201 (10.9%) |
| 12 to 14 Years | 1,360 (9.1%) | 1,521 (11.3%) |
| 15 Years | 565 (10.9%) | 749 (14.5%) |
| 16 and 17 Years | 827 (8.7%) | 1,037 (11.8%) |
| 18 to 24 Years | 4,517 (12.9%) | 5,005 (17.5%) |
| 25 to 34 Years | 5,322 (9.0%) | 6,810 (12.9%) |
| 35 to 44 Years | 4,165 (8.2%) | 4,304 (9.2%) |
| 45 to 54 Years | 3,074 (6.8%) | 2,977 (7.5%) |
| 55 to 64 Years | 4,581 (9.7%) | 4,332 (10.0%) |
| 65 to 74 Years | 2,469 (7.6%) | 2,368 (7.8%) |
| 75 Years and over | 902 (6.7%) | 1,501 (9.3%) |
| Total | 36,381 (9.7%) | 38,824 (11.3%) |
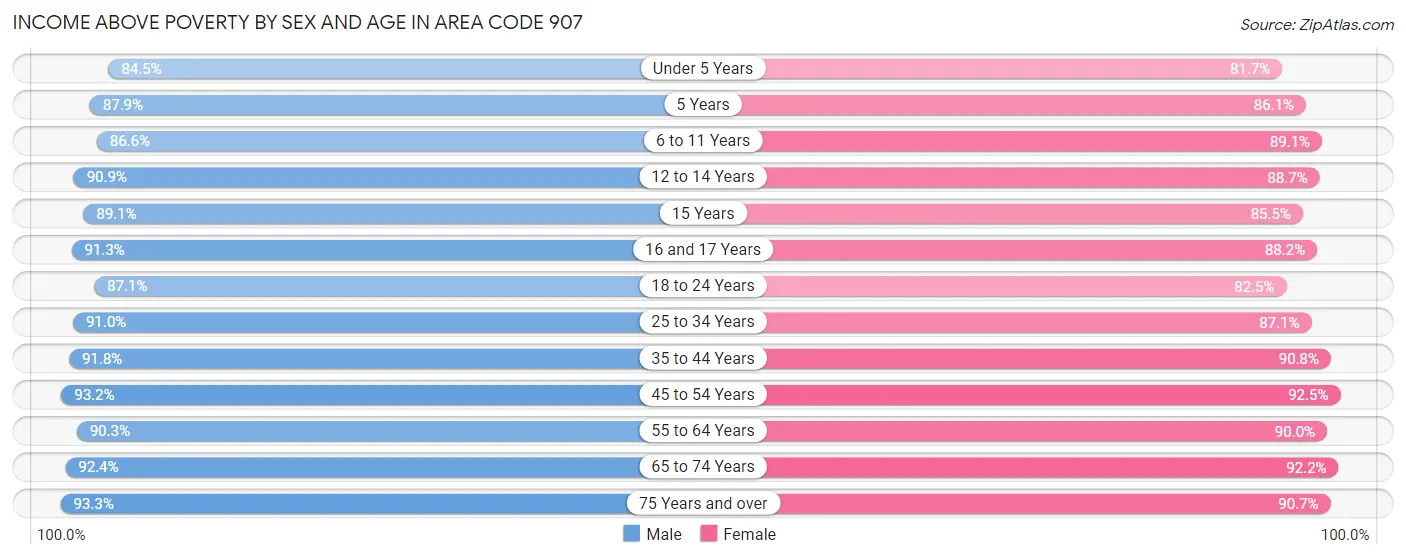
Income Above Poverty by Sex and Age in Area Code 907
According to the poverty statistics in Area Code 907, males aged 75 years and over and females aged 45 to 54 years are the age groups that are most secure financially, with 93.3% of males and 92.5% of females in these age groups living above the poverty line.
| Age Bracket | Male | Female |
| Under 5 Years | 20,866 (84.5%) | 19,094 (81.7%) |
| 5 Years | 4,200 (87.9%) | 4,675 (86.1%) |
| 6 to 11 Years | 26,984 (86.6%) | 26,228 (89.1%) |
| 12 to 14 Years | 13,553 (90.9%) | 11,892 (88.7%) |
| 15 Years | 4,613 (89.1%) | 4,431 (85.5%) |
| 16 and 17 Years | 8,684 (91.3%) | 7,753 (88.2%) |
| 18 to 24 Years | 30,478 (87.1%) | 23,609 (82.5%) |
| 25 to 34 Years | 53,913 (91.0%) | 46,152 (87.1%) |
| 35 to 44 Years | 46,408 (91.8%) | 42,333 (90.8%) |
| 45 to 54 Years | 41,991 (93.2%) | 36,764 (92.5%) |
| 55 to 64 Years | 42,722 (90.3%) | 39,156 (90.0%) |
| 65 to 74 Years | 30,126 (92.4%) | 27,891 (92.2%) |
| 75 Years and over | 12,618 (93.3%) | 14,625 (90.7%) |
| Total | 337,156 (90.3%) | 304,603 (88.7%) |
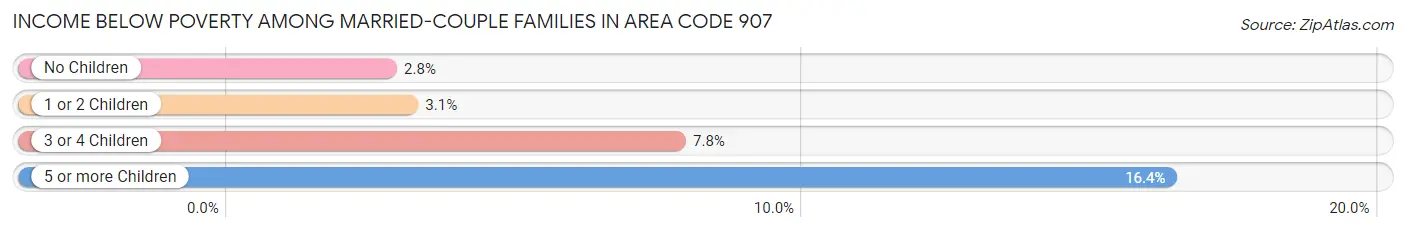
Income Below Poverty Among Married-Couple Families in Area Code 907
The poverty statistics for married-couple families in Area Code 907 show that 3.7% or 4,743 of the total 129,591 families live below the poverty line. Families with 5 or more children have the highest poverty rate of 16.4%, comprising of 388 families. On the other hand, families with no children have the lowest poverty rate of 2.8%, which includes 1,985 families.
| Children | Above Poverty | Below Poverty |
| No Children | 69,613 (97.2%) | 1,985 (2.8%) |
| 1 or 2 Children | 40,917 (96.9%) | 1,326 (3.1%) |
| 3 or 4 Children | 12,333 (92.2%) | 1,044 (7.8%) |
| 5 or more Children | 1,985 (83.7%) | 388 (16.4%) |
| Total | 124,848 (96.3%) | 4,743 (3.7%) |
Income Below Poverty Among Single-Parent Households in Area Code 907
According to the poverty data in Area Code 907, 13.7% or 2,085 single-father households and 20.7% or 5,428 single-mother households are living below the poverty line. Among single-father households, those with 5 or more children have the highest poverty rate, with 55 households (39.0%) experiencing poverty. Likewise, among single-mother households, those with 5 or more children have the highest poverty rate, with 361 households (63.4%) falling below the poverty line.
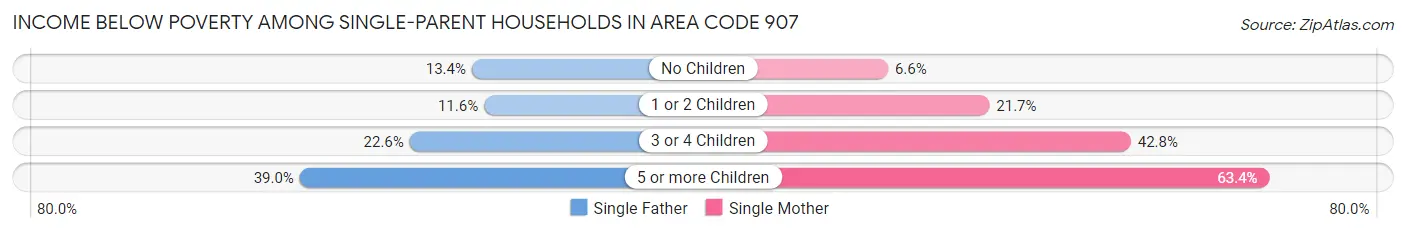
| Children | Single Father | Single Mother |
| No Children | 807 (13.4%) | 532 (6.6%) |
| 1 or 2 Children | 848 (11.6%) | 3,067 (21.7%) |
| 3 or 4 Children | 375 (22.6%) | 1,468 (42.8%) |
| 5 or more Children | 55 (39.0%) | 361 (63.4%) |
| Total | 2,085 (13.7%) | 5,428 (20.7%) |
Income Below Poverty Among Married-Couple vs Single-Parent Households in Area Code 907
The poverty data for Area Code 907 shows that 4,743 of the married-couple family households (3.7%) and 7,513 of the single-parent households (18.2%) are living below the poverty level. Within the married-couple family households, those with 5 or more children have the highest poverty rate, with 388 households (16.4%) falling below the poverty line. Among the single-parent households, those with 5 or more children have the highest poverty rate, with 416 household (58.6%) living below poverty.
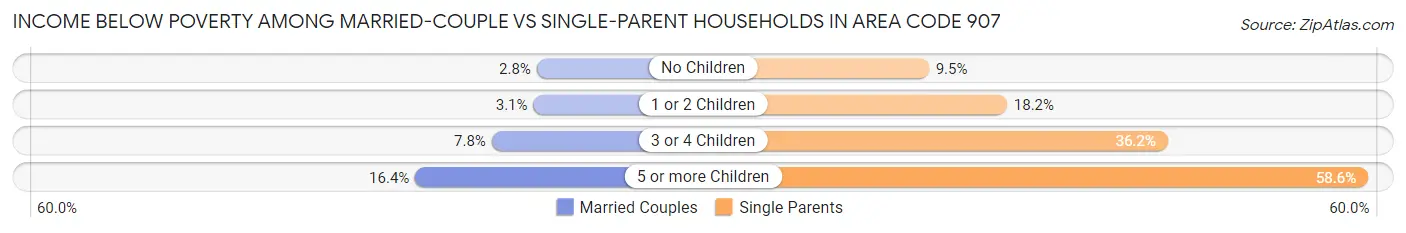
| Children | Married-Couple Families | Single-Parent Households |
| No Children | 1,985 (2.8%) | 1,339 (9.5%) |
| 1 or 2 Children | 1,326 (3.1%) | 3,915 (18.2%) |
| 3 or 4 Children | 1,044 (7.8%) | 1,843 (36.2%) |
| 5 or more Children | 388 (16.4%) | 416 (58.6%) |
| Total | 4,743 (3.7%) | 7,513 (18.2%) |
Race in Area Code 907
The most populous races in Area Code 907 are White / Caucasian (450,100 | 61.3%), Native / Alaskan (104,868 | 14.3%), and Two or more Races (82,692 | 11.3%).

| Race | # Population | % Population |
| Asian | 47,444 | 6.5% |
| Black / African American | 23,354 | 3.2% |
| Hawaiian / Pacific | 11,209 | 1.5% |
| Hispanic or Latino | 54,861 | 7.5% |
| Native / Alaskan | 104,868 | 14.3% |
| White / Caucasian | 450,100 | 61.3% |
| Two or more Races | 82,692 | 11.3% |
| Some other Race | 14,597 | 2.0% |
| Total | 734,264 | 100.0% |
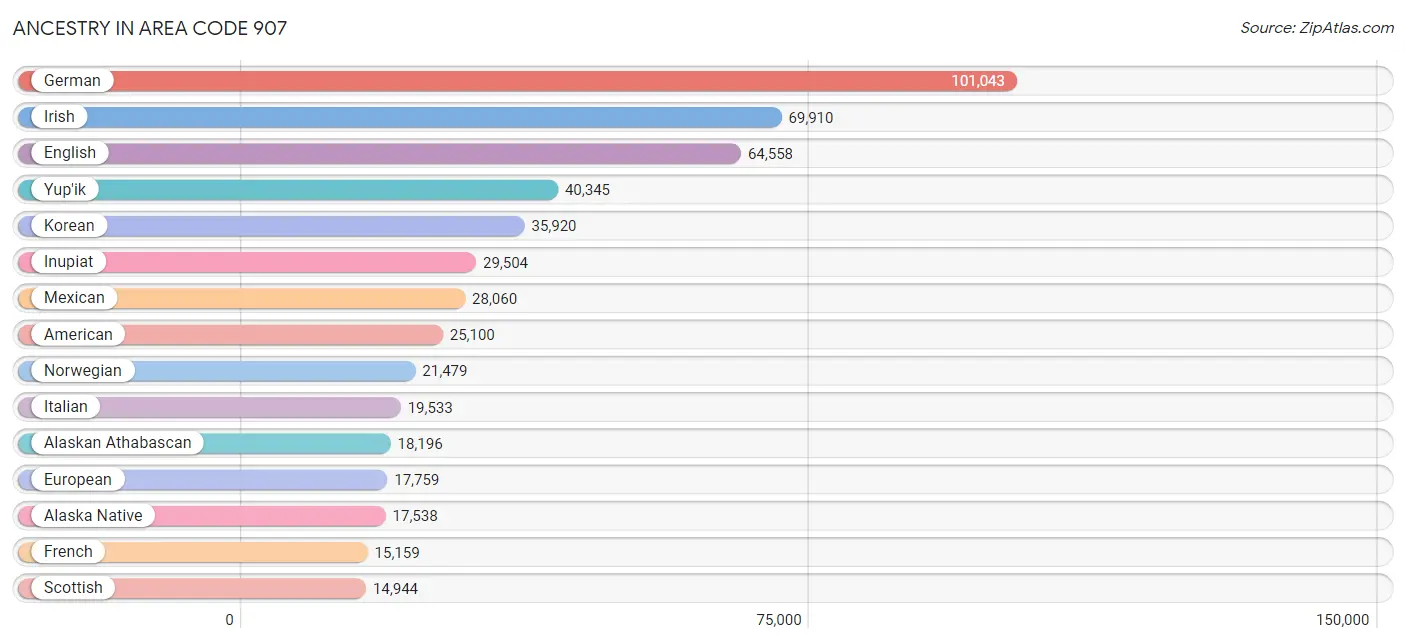
Ancestry in Area Code 907
The most populous ancestries reported in Area Code 907 are German (101,043 | 13.8%), Irish (69,910 | 9.5%), English (64,558 | 8.8%), Yup'ik (40,345 | 5.5%), and Korean (35,920 | 4.9%), together accounting for 42.4% of all Area Code 907 residents.
| Ancestry | # Population | % Population |
| Afghan | 43 | 0.0% |
| African | 2,111 | 0.3% |
| Alaska Native | 17,538 | 2.4% |
| Alaskan Athabascan | 18,196 | 2.5% |
| Albanian | 333 | 0.1% |
| Aleut | 12,831 | 1.8% |
| Alsatian | 12 | 0.0% |
| American | 25,100 | 3.4% |
| Apache | 551 | 0.1% |
| Arab | 905 | 0.1% |
| Arapaho | 126 | 0.0% |
| Argentinean | 246 | 0.0% |
| Armenian | 223 | 0.0% |
| Australian | 384 | 0.1% |
| Austrian | 1,356 | 0.2% |
| Bahamian | 42 | 0.0% |
| Bangladeshi | 5,909 | 0.8% |
| Barbadian | 49 | 0.0% |
| Basque | 40 | 0.0% |
| Belgian | 613 | 0.1% |
| Belizean | 60 | 0.0% |
| Bhutanese | 5,438 | 0.7% |
| Blackfeet | 1,079 | 0.2% |
| Bolivian | 57 | 0.0% |
| Brazilian | 297 | 0.0% |
| British | 5,852 | 0.8% |
| British West Indian | 45 | 0.0% |
| Bulgarian | 191 | 0.0% |
| Burmese | 6,860 | 0.9% |
| Cajun | 131 | 0.0% |
| Cambodian | 81 | 0.0% |
| Canadian | 1,854 | 0.3% |
| Cape Verdean | 31 | 0.0% |
| Carpatho Rusyn | 30 | 0.0% |
| Celtic | 197 | 0.0% |
| Central American | 3,632 | 0.5% |
| Central American Indian | 549 | 0.1% |
| Cherokee | 4,822 | 0.7% |
| Cheyenne | 163 | 0.0% |
| Chickasaw | 300 | 0.0% |
| Chilean | 50 | 0.0% |
| Chinese | 56 | 0.0% |
| Chippewa | 1,299 | 0.2% |
| Choctaw | 1,179 | 0.2% |
| Colombian | 1,990 | 0.3% |
| Colville | 21 | 0.0% |
| Comanche | 107 | 0.0% |
| Costa Rican | 218 | 0.0% |
| Cree | 200 | 0.0% |
| Creek | 346 | 0.1% |
| Croatian | 618 | 0.1% |
| Crow | 242 | 0.0% |
| Cuban | 2,360 | 0.3% |
| Cypriot | 10 | 0.0% |
| Czech | 3,493 | 0.5% |
| Czechoslovakian | 603 | 0.1% |
| Danish | 4,762 | 0.6% |
| Delaware | 18 | 0.0% |
| Dominican | 2,084 | 0.3% |
| Dutch | 9,351 | 1.3% |
| Dutch West Indian | 57 | 0.0% |
| Eastern European | 1,892 | 0.3% |
| Ecuadorian | 1,091 | 0.2% |
| Egyptian | 116 | 0.0% |
| English | 64,558 | 8.8% |
| Estonian | 98 | 0.0% |
| Ethiopian | 134 | 0.0% |
| European | 17,759 | 2.4% |
| Fijian | 69 | 0.0% |
| Filipino | 312 | 0.0% |
| Finnish | 4,112 | 0.6% |
| French | 15,159 | 2.1% |
| French American Indian | 437 | 0.1% |
| French Canadian | 5,011 | 0.7% |
| German | 101,043 | 13.8% |
| German Russian | 83 | 0.0% |
| Ghanaian | 6 | 0.0% |
| Greek | 1,190 | 0.2% |
| Guamanian / Chamorro | 1,081 | 0.2% |
| Guatemalan | 691 | 0.1% |
| Guyanese | 118 | 0.0% |
| Haitian | 355 | 0.1% |
| Hmong | 10 | 0.0% |
| Honduran | 472 | 0.1% |
| Hopi | 168 | 0.0% |
| Houma | 59 | 0.0% |
| Hungarian | 2,101 | 0.3% |
| Icelander | 287 | 0.0% |
| Indian (Asian) | 4,928 | 0.7% |
| Indonesian | 17 | 0.0% |
| Inupiat | 29,504 | 4.0% |
| Iranian | 424 | 0.1% |
| Iraqi | 5 | 0.0% |
| Irish | 69,910 | 9.5% |
| Iroquois | 269 | 0.0% |
| Israeli | 46 | 0.0% |
| Italian | 19,533 | 2.7% |
| Jamaican | 504 | 0.1% |
| Japanese | 538 | 0.1% |
| Kenyan | 52 | 0.0% |
| Kiowa | 14 | 0.0% |
| Korean | 35,920 | 4.9% |
| Laotian | 290 | 0.0% |
| Latvian | 156 | 0.0% |
| Lebanese | 290 | 0.0% |
| Liberian | 135 | 0.0% |
| Lithuanian | 967 | 0.1% |
| Lumbee | 140 | 0.0% |
| Luxembourger | 49 | 0.0% |
| Macedonian | 264 | 0.0% |
| Malaysian | 1,053 | 0.1% |
| Maltese | 3 | 0.0% |
| Marshallese | 47 | 0.0% |
| Menominee | 33 | 0.0% |
| Mexican | 28,060 | 3.8% |
| Mexican American Indian | 435 | 0.1% |
| Mongolian | 94 | 0.0% |
| Moroccan | 89 | 0.0% |
| Native Hawaiian | 4,076 | 0.6% |
| Navajo | 388 | 0.1% |
| Nepalese | 45 | 0.0% |
| New Zealander | 163 | 0.0% |
| Nicaraguan | 295 | 0.0% |
| Nigerian | 408 | 0.1% |
| Northern European | 2,887 | 0.4% |
| Norwegian | 21,479 | 2.9% |
| Okinawan | 13 | 0.0% |
| Osage | 172 | 0.0% |
| Ottawa | 11 | 0.0% |
| Paiute | 29 | 0.0% |
| Pakistani | 1,507 | 0.2% |
| Palestinian | 9 | 0.0% |
| Panamanian | 663 | 0.1% |
| Paraguayan | 37 | 0.0% |
| Pennsylvania German | 76 | 0.0% |
| Peruvian | 585 | 0.1% |
| Pima | 5 | 0.0% |
| Polish | 12,973 | 1.8% |
| Portuguese | 1,832 | 0.3% |
| Potawatomi | 170 | 0.0% |
| Pueblo | 162 | 0.0% |
| Puerto Rican | 8,133 | 1.1% |
| Puget Sound Salish | 418 | 0.1% |
| Romanian | 678 | 0.1% |
| Russian | 7,500 | 1.0% |
| Salvadoran | 1,293 | 0.2% |
| Samoan | 9,032 | 1.2% |
| Scandinavian | 6,277 | 0.9% |
| Scotch-Irish | 8,084 | 1.1% |
| Scottish | 14,944 | 2.0% |
| Seminole | 57 | 0.0% |
| Senegalese | 3 | 0.0% |
| Serbian | 589 | 0.1% |
| Shoshone | 163 | 0.0% |
| Sierra Leonean | 45 | 0.0% |
| Sioux | 1,180 | 0.2% |
| Slavic | 436 | 0.1% |
| Slovak | 610 | 0.1% |
| Slovene | 254 | 0.0% |
| Somali | 242 | 0.0% |
| South African | 62 | 0.0% |
| South American | 4,343 | 0.6% |
| South American Indian | 186 | 0.0% |
| Spaniard | 1,959 | 0.3% |
| Spanish | 2,152 | 0.3% |
| Spanish American | 32 | 0.0% |
| Sri Lankan | 1,989 | 0.3% |
| Subsaharan African | 5,158 | 0.7% |
| Sudanese | 1,259 | 0.2% |
| Swedish | 14,170 | 1.9% |
| Swiss | 2,631 | 0.4% |
| Syrian | 120 | 0.0% |
| Thai | 1,679 | 0.2% |
| Tlingit-Haida | 12,508 | 1.7% |
| Tohono O'Odham | 75 | 0.0% |
| Tongan | 1,919 | 0.3% |
| Trinidadian and Tobagonian | 102 | 0.0% |
| Tsimshian | 2,260 | 0.3% |
| Turkish | 98 | 0.0% |
| Ugandan | 29 | 0.0% |
| Ukrainian | 2,639 | 0.4% |
| Uruguayan | 33 | 0.0% |
| Ute | 181 | 0.0% |
| Venezuelan | 212 | 0.0% |
| Vietnamese | 47 | 0.0% |
| Welsh | 4,980 | 0.7% |
| West Indian | 115 | 0.0% |
| Yakama | 136 | 0.0% |
| Yaqui | 88 | 0.0% |
| Yugoslavian | 296 | 0.0% |
| Yuman | 105 | 0.0% |
| Yup'ik | 40,345 | 5.5% |
| Zimbabwean | 113 | 0.0% | View All 193 Rows |
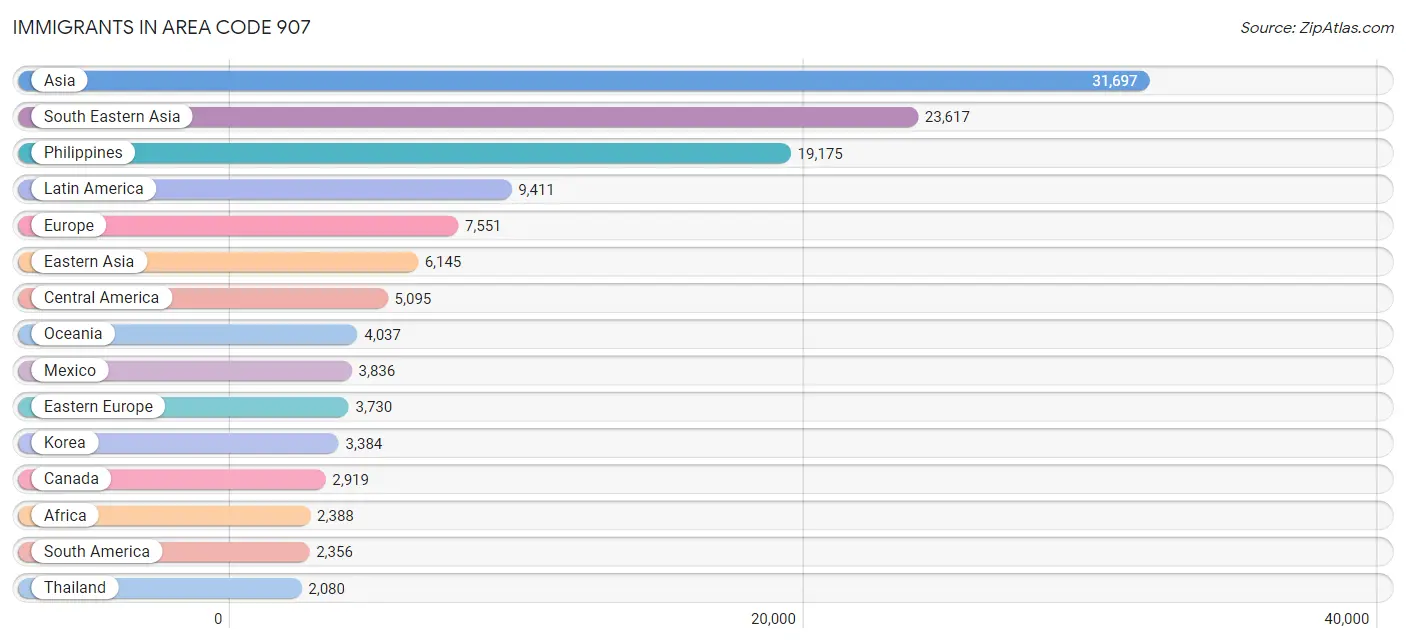
Immigrants in Area Code 907
The most numerous immigrant groups reported in Area Code 907 came from Asia (31,697 | 4.3%), South Eastern Asia (23,617 | 3.2%), Philippines (19,175 | 2.6%), Latin America (9,411 | 1.3%), and Europe (7,551 | 1.0%), together accounting for 12.5% of all Area Code 907 residents.
| Immigration Origin | # Population | % Population |
| Afghanistan | 18 | 0.0% |
| Africa | 2,388 | 0.3% |
| Albania | 16 | 0.0% |
| Argentina | 137 | 0.0% |
| Armenia | 1 | 0.0% |
| Asia | 31,697 | 4.3% |
| Australia | 289 | 0.0% |
| Austria | 16 | 0.0% |
| Azores | 13 | 0.0% |
| Bahamas | 6 | 0.0% |
| Bangladesh | 47 | 0.0% |
| Barbados | 6 | 0.0% |
| Belarus | 34 | 0.0% |
| Belgium | 33 | 0.0% |
| Belize | 53 | 0.0% |
| Bolivia | 3 | 0.0% |
| Bosnia and Herzegovina | 52 | 0.0% |
| Brazil | 512 | 0.1% |
| Bulgaria | 107 | 0.0% |
| Cambodia | 160 | 0.0% |
| Cameroon | 94 | 0.0% |
| Canada | 2,919 | 0.4% |
| Caribbean | 1,960 | 0.3% |
| Central America | 5,095 | 0.7% |
| Chile | 15 | 0.0% |
| China | 1,815 | 0.3% |
| Colombia | 599 | 0.1% |
| Costa Rica | 2 | 0.0% |
| Cuba | 495 | 0.1% |
| Czechoslovakia | 170 | 0.0% |
| Denmark | 21 | 0.0% |
| Dominica | 97 | 0.0% |
| Dominican Republic | 840 | 0.1% |
| Eastern Africa | 693 | 0.1% |
| Eastern Asia | 6,145 | 0.8% |
| Eastern Europe | 3,730 | 0.5% |
| Ecuador | 242 | 0.0% |
| Egypt | 38 | 0.0% |
| El Salvador | 483 | 0.1% |
| England | 376 | 0.1% |
| Ethiopia | 116 | 0.0% |
| Europe | 7,551 | 1.0% |
| Fiji | 195 | 0.0% |
| France | 188 | 0.0% |
| Germany | 1,382 | 0.2% |
| Ghana | 125 | 0.0% |
| Greece | 10 | 0.0% |
| Grenada | 39 | 0.0% |
| Guatemala | 270 | 0.0% |
| Guyana | 76 | 0.0% |
| Haiti | 158 | 0.0% |
| Honduras | 192 | 0.0% |
| Hong Kong | 202 | 0.0% |
| Hungary | 21 | 0.0% |
| India | 615 | 0.1% |
| Indonesia | 76 | 0.0% |
| Iran | 310 | 0.0% |
| Iraq | 27 | 0.0% |
| Ireland | 196 | 0.0% |
| Israel | 7 | 0.0% |
| Italy | 205 | 0.0% |
| Jamaica | 206 | 0.0% |
| Japan | 910 | 0.1% |
| Jordan | 4 | 0.0% |
| Kazakhstan | 56 | 0.0% |
| Kenya | 159 | 0.0% |
| Korea | 3,384 | 0.5% |
| Kuwait | 21 | 0.0% |
| Laos | 1,137 | 0.2% |
| Latin America | 9,411 | 1.3% |
| Latvia | 19 | 0.0% |
| Lebanon | 1 | 0.0% |
| Liberia | 90 | 0.0% |
| Lithuania | 133 | 0.0% |
| Malaysia | 95 | 0.0% |
| Mexico | 3,836 | 0.5% |
| Micronesia | 197 | 0.0% |
| Middle Africa | 209 | 0.0% |
| Moldova | 368 | 0.1% |
| Morocco | 1 | 0.0% |
| Nepal | 258 | 0.0% |
| Netherlands | 122 | 0.0% |
| Nicaragua | 78 | 0.0% |
| Nigeria | 281 | 0.0% |
| North Macedonia | 171 | 0.0% |
| Northern Africa | 494 | 0.1% |
| Northern Europe | 1,564 | 0.2% |
| Norway | 159 | 0.0% |
| Oceania | 4,037 | 0.5% |
| Pakistan | 138 | 0.0% |
| Panama | 181 | 0.0% |
| Peru | 464 | 0.1% |
| Philippines | 19,175 | 2.6% |
| Poland | 389 | 0.1% |
| Portugal | 36 | 0.0% |
| Romania | 114 | 0.0% |
| Russia | 863 | 0.1% |
| Scotland | 147 | 0.0% |
| Senegal | 3 | 0.0% |
| Serbia | 91 | 0.0% |
| Somalia | 63 | 0.0% |
| South Africa | 177 | 0.0% |
| South America | 2,356 | 0.3% |
| South Central Asia | 1,546 | 0.2% |
| South Eastern Asia | 23,617 | 3.2% |
| Southern Europe | 334 | 0.1% |
| Spain | 83 | 0.0% |
| Sri Lanka | 43 | 0.0% |
| St. Vincent and the Grenadines | 1 | 0.0% |
| Sudan | 391 | 0.1% |
| Sweden | 192 | 0.0% |
| Switzerland | 129 | 0.0% |
| Syria | 95 | 0.0% |
| Taiwan | 313 | 0.0% |
| Thailand | 2,080 | 0.3% |
| Trinidad and Tobago | 48 | 0.0% |
| Turkey | 158 | 0.0% |
| Uganda | 42 | 0.0% |
| Ukraine | 1,059 | 0.1% |
| Uruguay | 19 | 0.0% |
| Uzbekistan | 31 | 0.0% |
| Venezuela | 218 | 0.0% |
| Vietnam | 868 | 0.1% |
| Western Africa | 709 | 0.1% |
| Western Asia | 377 | 0.1% |
| Western Europe | 1,870 | 0.3% |
| Zimbabwe | 96 | 0.0% | View All 127 Rows |
Sex and Age in Area Code 907
Sex and Age in Area Code 907
The most populous age groups in Area Code 907 are 25 to 29 Years (31,567 | 8.2%) for men and 30 to 34 Years (27,380 | 7.9%) for women.
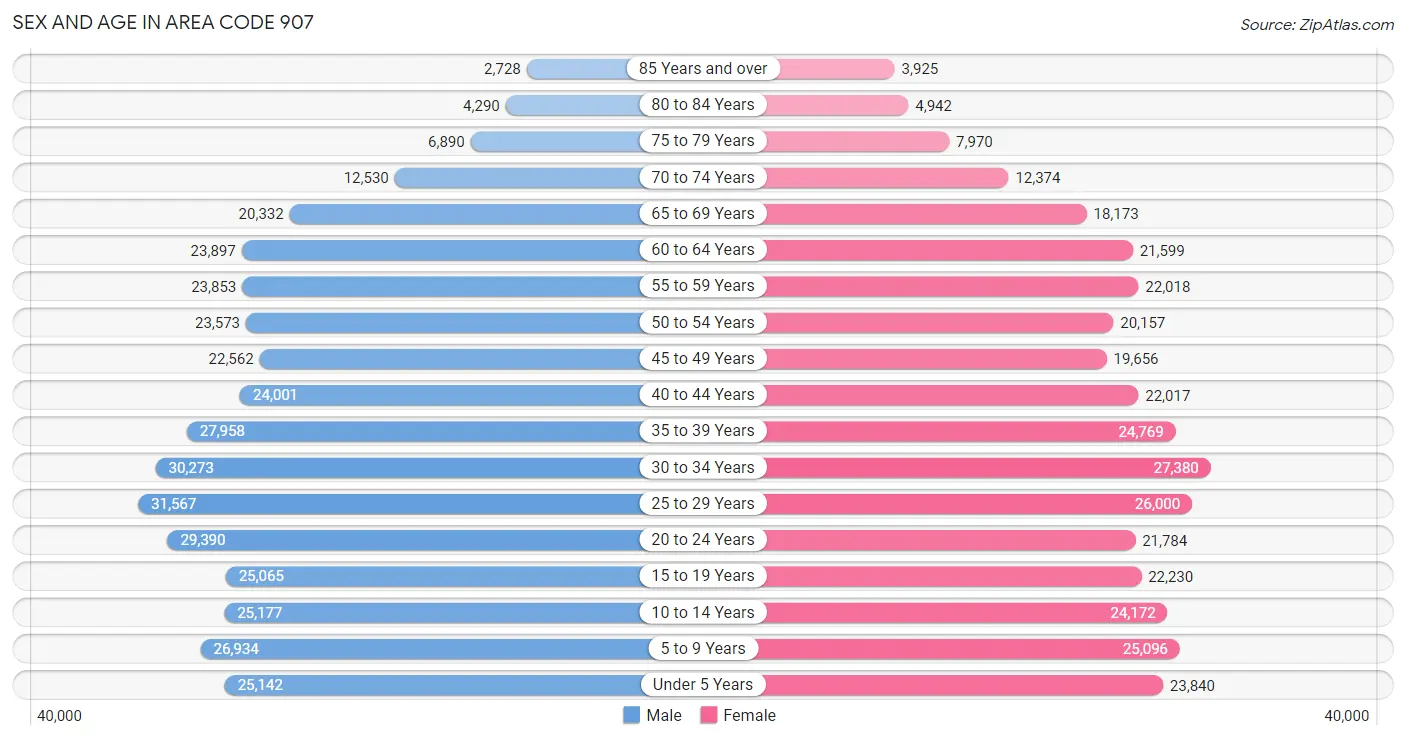
| Age Bracket | Male | Female |
| Under 5 Years | 25,142 (6.5%) | 23,840 (6.9%) |
| 5 to 9 Years | 26,934 (7.0%) | 25,096 (7.2%) |
| 10 to 14 Years | 25,177 (6.5%) | 24,172 (6.9%) |
| 15 to 19 Years | 25,065 (6.5%) | 22,230 (6.4%) |
| 20 to 24 Years | 29,390 (7.6%) | 21,784 (6.3%) |
| 25 to 29 Years | 31,567 (8.2%) | 26,000 (7.5%) |
| 30 to 34 Years | 30,273 (7.8%) | 27,380 (7.9%) |
| 35 to 39 Years | 27,958 (7.2%) | 24,769 (7.1%) |
| 40 to 44 Years | 24,001 (6.2%) | 22,017 (6.3%) |
| 45 to 49 Years | 22,562 (5.8%) | 19,656 (5.7%) |
| 50 to 54 Years | 23,573 (6.1%) | 20,157 (5.8%) |
| 55 to 59 Years | 23,853 (6.2%) | 22,018 (6.3%) |
| 60 to 64 Years | 23,897 (6.2%) | 21,599 (6.2%) |
| 65 to 69 Years | 20,332 (5.3%) | 18,173 (5.2%) |
| 70 to 74 Years | 12,530 (3.2%) | 12,374 (3.5%) |
| 75 to 79 Years | 6,890 (1.8%) | 7,970 (2.3%) |
| 80 to 84 Years | 4,290 (1.1%) | 4,942 (1.4%) |
| 85 Years and over | 2,728 (0.7%) | 3,925 (1.1%) |
| Total | 386,162 (100.0%) | 348,102 (100.0%) |
Families and Households in Area Code 907
Median Family Size in Area Code 907
The median family size in Area Code 907 is 3.69 persons per family, with married-couple families (129,591 | 75.8%) accounting for the largest median family size of 4.04166 persons per family. On the other hand, single male/father families (15,178 | 8.9%) represent the smallest median family size with 3.30 persons per family.
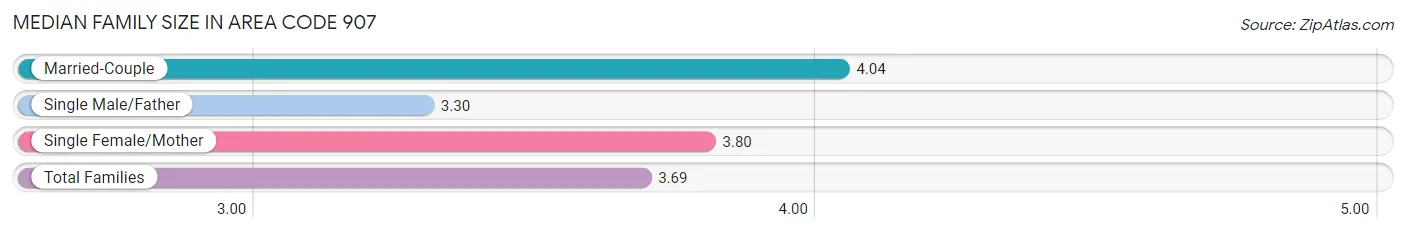
| Family Type | # Families | Family Size |
| Married-Couple | 129,591 (75.8%) | 4.04 |
| Single Male/Father | 15,178 (8.9%) | 3.30 |
| Single Female/Mother | 26,188 (15.3%) | 3.80 |
| Total Families | 170,957 (100.0%) | 3.69 |
Median Household Size in Area Code 907
The median household size in Area Code 907 is 3.08 persons per household, with single female/mother households (26,188 | 9.9%) accounting for the largest median household size of 4.12801 persons per household. non-family households (93,405 | 35.3%) represent the smallest median household size with 1.31 persons per household.
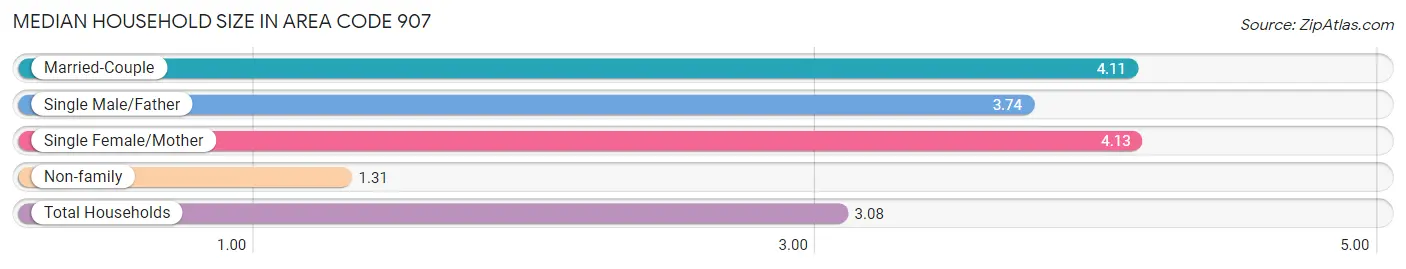
| Household Type | # Households | Household Size |
| Married-Couple | 129,591 (49.0%) | 4.11 |
| Single Male/Father | 15,178 (5.7%) | 3.74 |
| Single Female/Mother | 26,188 (9.9%) | 4.13 |
| Non-family | 93,405 (35.3%) | 1.31 |
| Total Households | 264,362 (100.0%) | 3.08 |
Household Size by Marriage Status in Area Code 907
Out of a total of 264,362 households in Area Code 907, 170,957 (64.7%) are family households, while 93,405 (35.3%) are nonfamily households. The most numerous type of family households are 2-person households, comprising 71,280, and the most common type of nonfamily households are 1-person households, comprising 72,802.
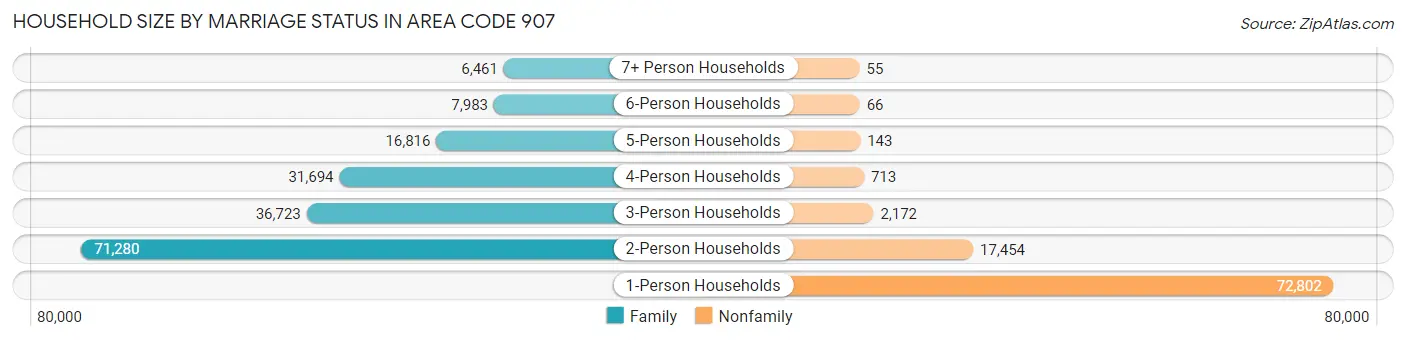
| Household Size | Family Households | Nonfamily Households |
| 1-Person Households | - | 72,802 (27.5%) |
| 2-Person Households | 71,280 (27.0%) | 17,454 (6.6%) |
| 3-Person Households | 36,723 (13.9%) | 2,172 (0.8%) |
| 4-Person Households | 31,694 (12.0%) | 713 (0.3%) |
| 5-Person Households | 16,816 (6.4%) | 143 (0.1%) |
| 6-Person Households | 7,983 (3.0%) | 66 (0.0%) |
| 7+ Person Households | 6,461 (2.4%) | 55 (0.0%) |
| Total | 170,957 (64.7%) | 93,405 (35.3%) |
Female Fertility in Area Code 907
Fertility by Age in Area Code 907
Average fertility rate in Area Code 907 is 95.2 births per 1,000 women. Women in the age bracket of 20 to 34 years have the highest fertility rate with 175.7 births per 1,000 women. Women in the age bracket of 20 to 34 years acount for 70.7% of all women with births.
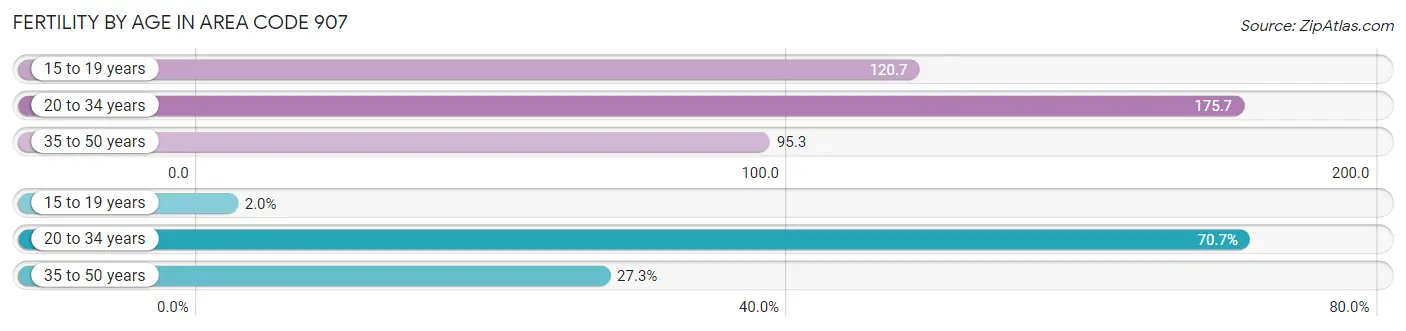
| Age Bracket | Women with Births | Births / 1,000 Women |
| 15 to 19 years | 211 (2.0%) | 120.7 |
| 20 to 34 years | 7,389 (70.7%) | 175.7 |
| 35 to 50 years | 2,852 (27.3%) | 95.3 |
| Total | 10,452 (100.0%) | 95.2 |
Fertility by Age by Marriage Status in Area Code 907
34.9% of women with births (10,452) in Area Code 907 are married. The highest percentage of unmarried women with births falls into 15 to 19 years age bracket with 94.8% of them unmarried at the time of birth, while the lowest percentage of unmarried women with births belong to 35 to 50 years age bracket with 67.8% of them unmarried.
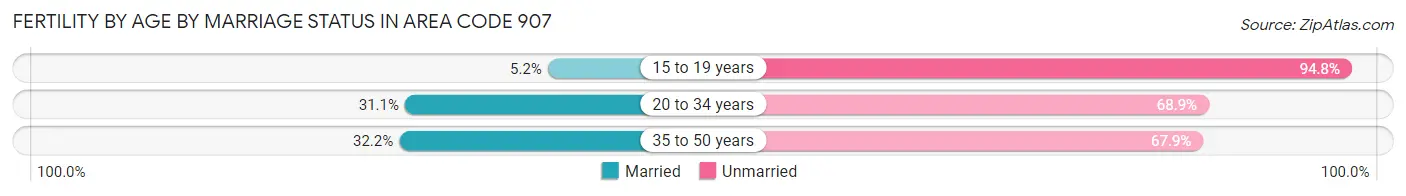
| Age Bracket | Married | Unmarried |
| 15 to 19 years | 11 (5.2%) | 200 (94.8%) |
| 20 to 34 years | 2,299 (31.1%) | 5,090 (68.9%) |
| 35 to 50 years | 917 (32.2%) | 1,935 (67.8%) |
| Total | 3,644 (34.9%) | 6,808 (65.1%) |
Fertility by Education in Area Code 907
Average fertility rate in Area Code 907 is 95.2 births per 1,000 women. Women with the education attainment of graduate degree have the highest fertility rate of 211.2 births per 1,000 women, while women with the education attainment of high school diploma have the lowest fertility at 123.2 births per 1,000 women. Women with the education attainment of college or associate's degree represent 31.5% of all women with births.
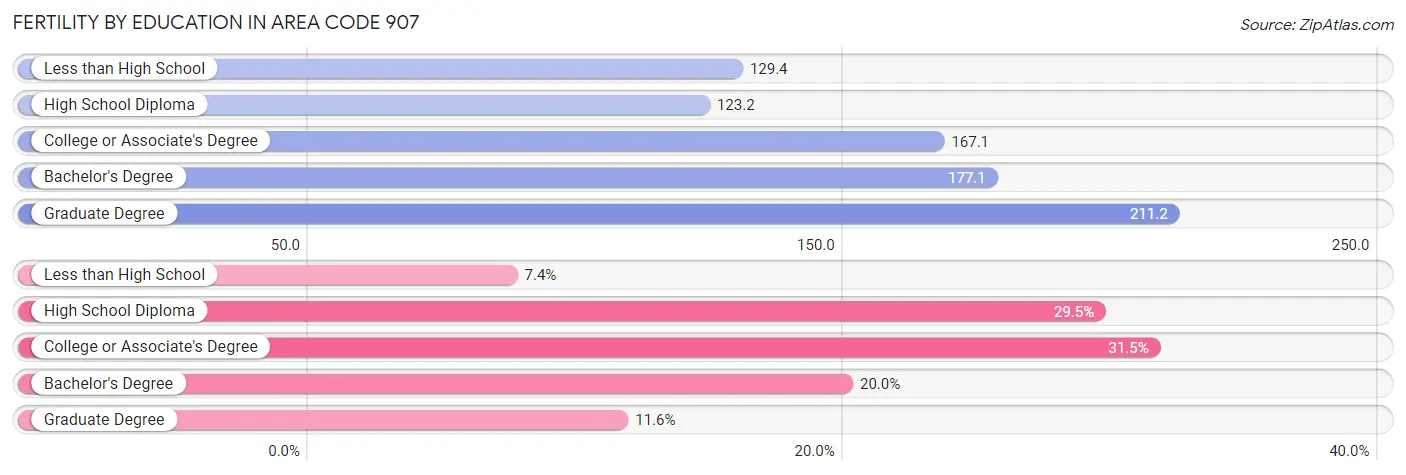
| Educational Attainment | Women with Births | Births / 1,000 Women |
| Less than High School | 777 (7.4%) | 129.4 |
| High School Diploma | 3,081 (29.5%) | 123.2 |
| College or Associate's Degree | 3,294 (31.5%) | 167.1 |
| Bachelor's Degree | 2,090 (20.0%) | 177.1 |
| Graduate Degree | 1,210 (11.6%) | 211.2 |
| Total | 10,452 (100.0%) | 95.2 |
Fertility by Education by Marriage Status in Area Code 907
65.1% of women with births in Area Code 907 are unmarried. Women with the educational attainment of bachelor's degree are most likely to be married with 55.3% of them married at childbirth, while women with the educational attainment of less than high school are least likely to be married with 87.0% of them unmarried at childbirth.
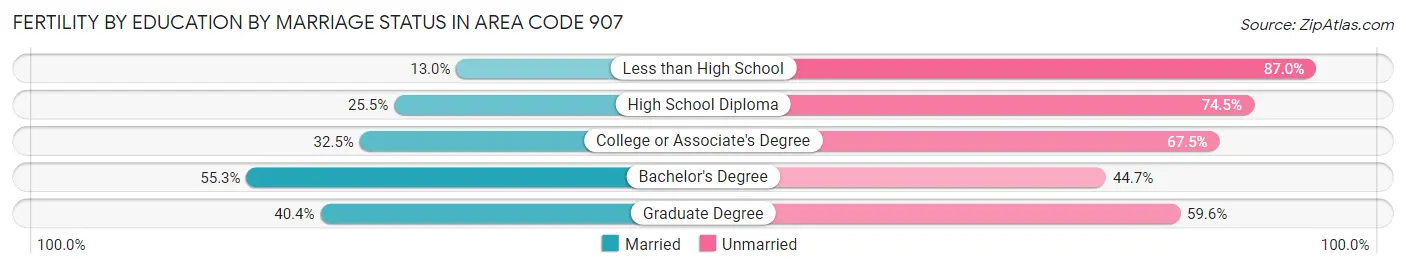
| Educational Attainment | Married | Unmarried |
| Less than High School | 101 (13.0%) | 676 (87.0%) |
| High School Diploma | 787 (25.5%) | 2,294 (74.5%) |
| College or Associate's Degree | 1,070 (32.5%) | 2,224 (67.5%) |
| Bachelor's Degree | 1,156 (55.3%) | 934 (44.7%) |
| Graduate Degree | 489 (40.4%) | 721 (59.6%) |
| Total | 3,644 (34.9%) | 6,808 (65.1%) |
Employment Characteristics in Area Code 907
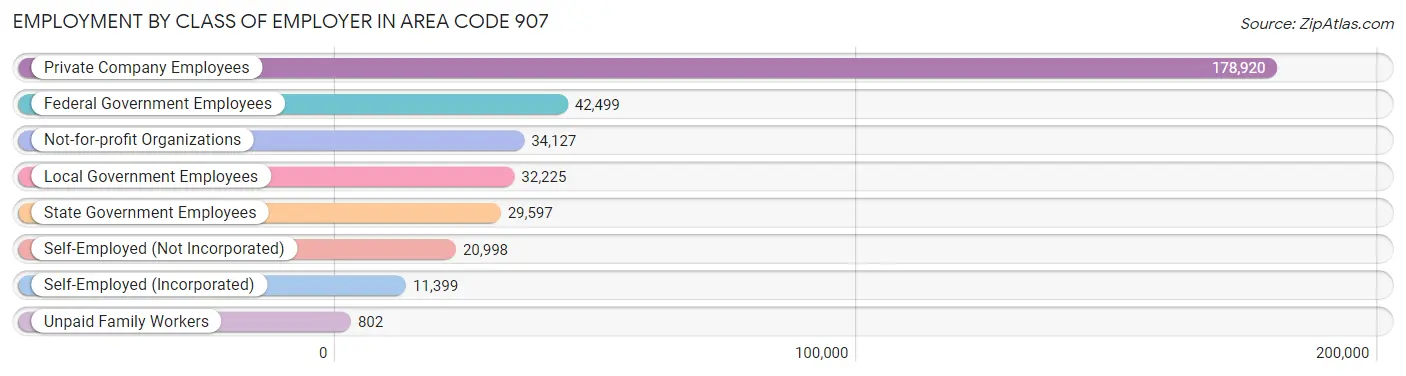
Employment by Class of Employer in Area Code 907
Among the 350,567 employed individuals in Area Code 907, private company employees (178,920 | 51.0%), federal government employees (42,499 | 12.1%), and not-for-profit organizations (34,127 | 9.7%) make up the most common classes of employment.
| Employer Class | # Employees | % Employees |
| Private Company Employees | 178,920 | 51.0% |
| Self-Employed (Incorporated) | 11,399 | 3.3% |
| Self-Employed (Not Incorporated) | 20,998 | 6.0% |
| Not-for-profit Organizations | 34,127 | 9.7% |
| Local Government Employees | 32,225 | 9.2% |
| State Government Employees | 29,597 | 8.4% |
| Federal Government Employees | 42,499 | 12.1% |
| Unpaid Family Workers | 802 | 0.2% |
| Total | 350,567 | 100.0% |
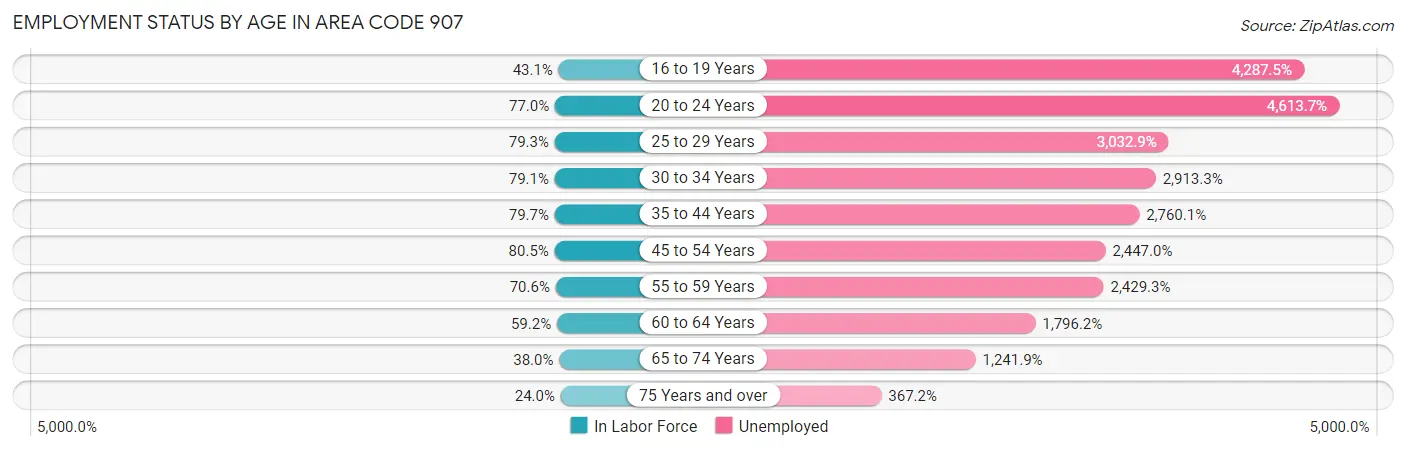
Employment Status by Age in Area Code 907
According to the labor force statistics for Area Code 907, out of the total population over 16 years of age (573,477), 63.1% or 362,036 individuals are in the labor force, with 15.3% or 55,247 of them unemployed. The age group with the highest labor force participation rate is 45 to 54 years, with 80.5% or 69,205 individuals in the labor force. Within the labor force, the 20 to 24 years age range has the highest percentage of unemployed individuals, with 4,613.7% or 1,817,060 of them being unemployed.
| Age Bracket | In Labor Force | Unemployed |
| 16 to 19 Years | 15,879 (43.1%) | 680,812 (4,287.5%) |
| 20 to 24 Years | 39,385 (77.0%) | 1,817,060 (4,613.7%) |
| 25 to 29 Years | 45,639 (79.3%) | 1,384,185 (3,032.9%) |
| 30 to 34 Years | 45,602 (79.1%) | 1,328,581 (2,913.3%) |
| 35 to 44 Years | 78,712 (79.7%) | 2,172,475 (2,760.1%) |
| 45 to 54 Years | 69,205 (80.5%) | 1,693,446 (2,447.0%) |
| 55 to 59 Years | 32,375 (70.6%) | 786,510 (2,429.3%) |
| 60 to 64 Years | 26,944 (59.2%) | 483,950 (1,796.2%) |
| 65 to 74 Years | 24,090 (38.0%) | 299,161 (1,241.9%) |
| 75 Years and over | 7,365 (24.0%) | 27,052 (367.2%) |
| Total | 362,016 (63.1%) | 55,263 (15.3%) |
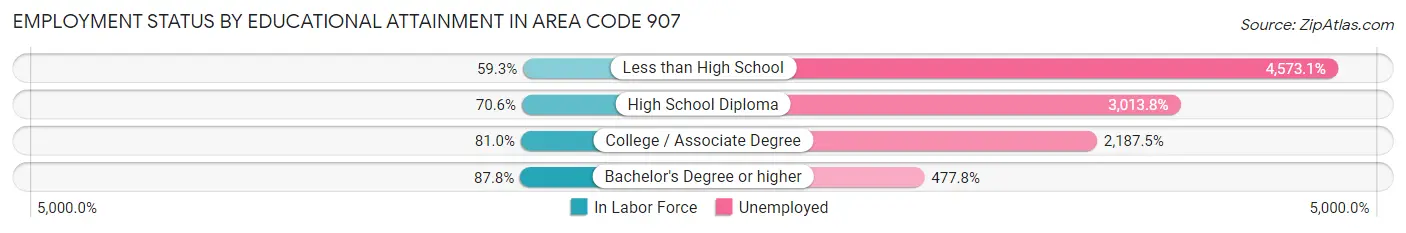
Employment Status by Educational Attainment in Area Code 907
According to labor force statistics for Area Code 907, 73.6% of individuals (288,099) out of the total population between 25 and 64 years of age (391,280) are in the labor force, with 2,835.8% or 8,169,911 of them being unemployed. The group with the highest labor force participation rate are those with the educational attainment of bachelor's degree or higher, with 87.8% or 104,209 individuals in the labor force. Within the labor force, individuals with less than high school education have the highest percentage of unemployment, with 4,573.1% or 650,432 of them being unemployed.
| Educational Attainment | In Labor Force | Unemployed |
| Less than High School | 14,223 (59.3%) | 1,096,081 (4,573.1%) |
| High School Diploma | 80,539 (70.6%) | 3,439,439 (3,013.8%) |
| College / Associate Degree | 108,893 (81.0%) | 2,941,881 (2,187.5%) |
| Bachelor's Degree or higher | 104,211 (87.8%) | 567,163 (477.8%) |
| Total | 288,105 (73.6%) | 11,095,918 (2,835.8%) |
Employment Occupations by Sex in Area Code 907
Management, Business, Science and Arts Occupations
The most common Management, Business, Science and Arts occupations in Area Code 907 are Community & Social Service (38,408 | 11.3%), Management (36,545 | 10.8%), Education Instruction & Library (22,262 | 6.6%), Computers, Engineering & Science (21,191 | 6.3%), and Health Diagnosing & Treating (19,505 | 5.8%).
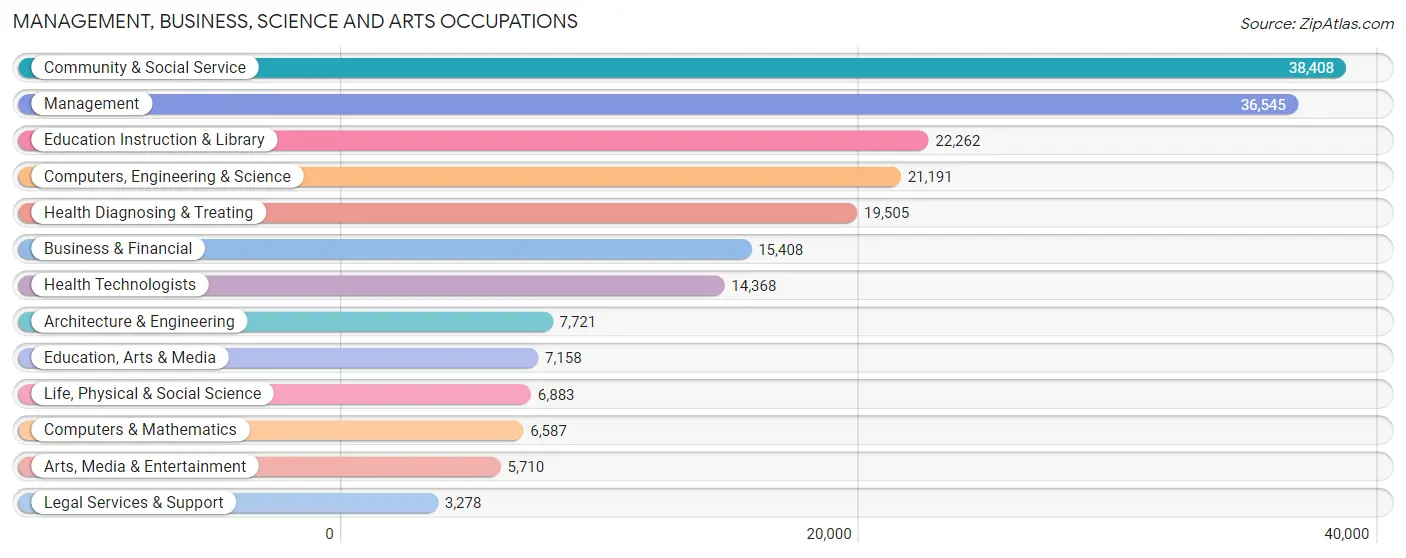
Management, Business, Science and Arts Occupations by Sex
Within the Management, Business, Science and Arts occupations in Area Code 907, the most male-oriented occupations are Architecture & Engineering (82.0%), Computers & Mathematics (75.4%), and Computers, Engineering & Science (70.2%), while the most female-oriented occupations are Health Technologists (76.4%), Health Diagnosing & Treating (73.0%), and Education Instruction & Library (71.4%).
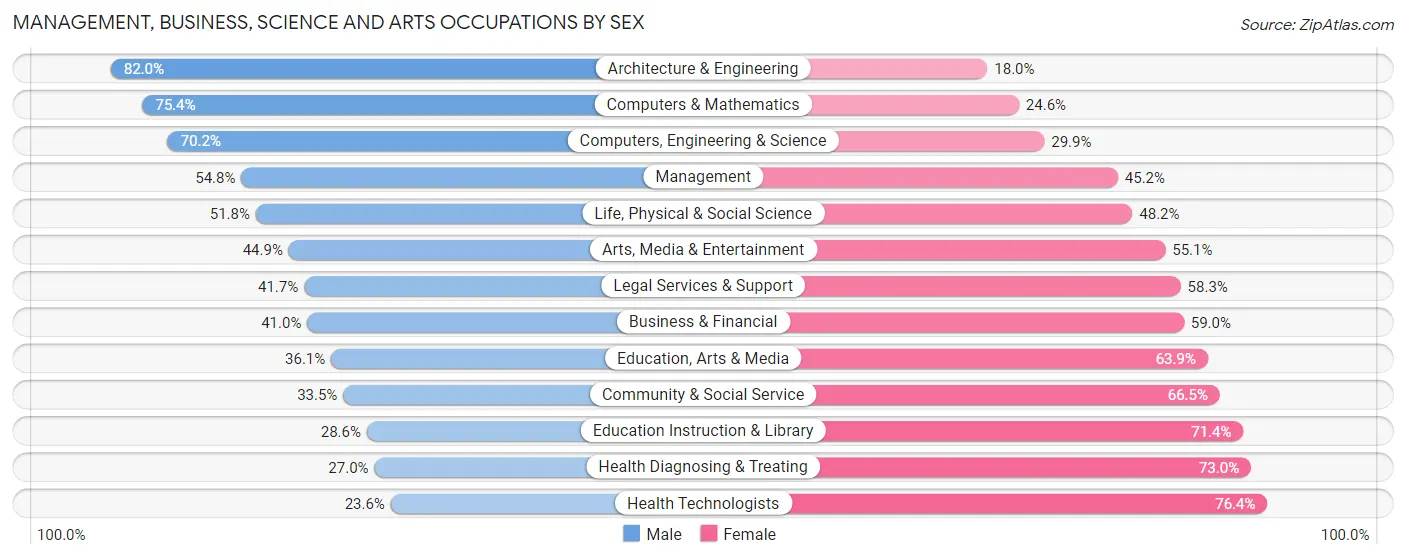
| Occupation | Male | Female |
| Management | 20,026 (54.8%) | 16,519 (45.2%) |
| Business & Financial | 6,323 (41.0%) | 9,085 (59.0%) |
| Computers, Engineering & Science | 14,865 (70.2%) | 6,326 (29.8%) |
| Computers & Mathematics | 4,969 (75.4%) | 1,618 (24.6%) |
| Architecture & Engineering | 6,333 (82.0%) | 1,388 (18.0%) |
| Life, Physical & Social Science | 3,563 (51.8%) | 3,320 (48.2%) |
| Community & Social Service | 12,883 (33.5%) | 25,525 (66.5%) |
| Education, Arts & Media | 2,581 (36.1%) | 4,577 (63.9%) |
| Legal Services & Support | 1,367 (41.7%) | 1,911 (58.3%) |
| Education Instruction & Library | 6,371 (28.6%) | 15,891 (71.4%) |
| Arts, Media & Entertainment | 2,564 (44.9%) | 3,146 (55.1%) |
| Health Diagnosing & Treating | 5,273 (27.0%) | 14,232 (73.0%) |
| Health Technologists | 3,395 (23.6%) | 10,973 (76.4%) |
| Total (Category) | 59,370 (45.3%) | 71,687 (54.7%) |
| Total (Overall) | 181,982 (53.7%) | 156,748 (46.3%) |
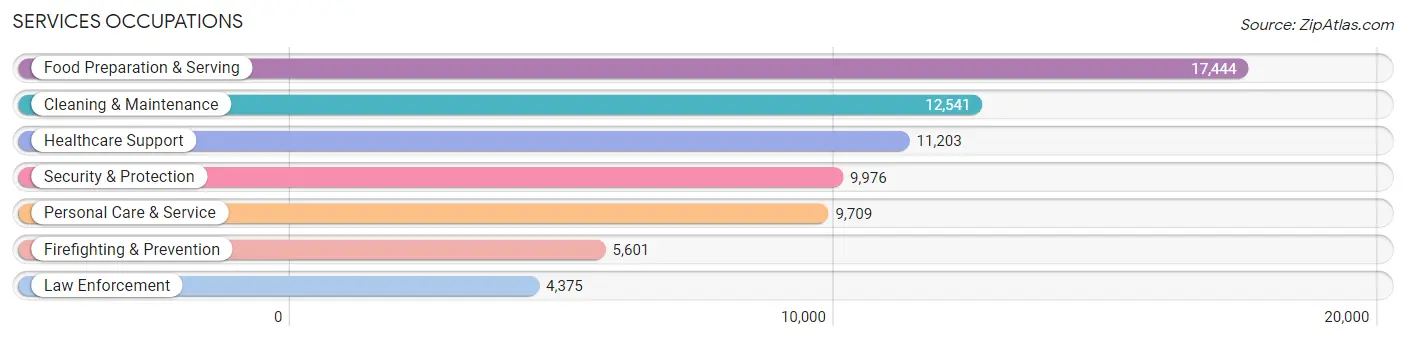
Services Occupations
The most common Services occupations in Area Code 907 are Food Preparation & Serving (17,444 | 5.1%), Cleaning & Maintenance (12,541 | 3.7%), Healthcare Support (11,203 | 3.3%), Security & Protection (9,976 | 2.9%), and Personal Care & Service (9,709 | 2.9%).
Services Occupations by Sex
Within the Services occupations in Area Code 907, the most male-oriented occupations are Law Enforcement (83.8%), Security & Protection (78.1%), and Firefighting & Prevention (73.7%), while the most female-oriented occupations are Healthcare Support (83.3%), Personal Care & Service (68.8%), and Food Preparation & Serving (50.6%).
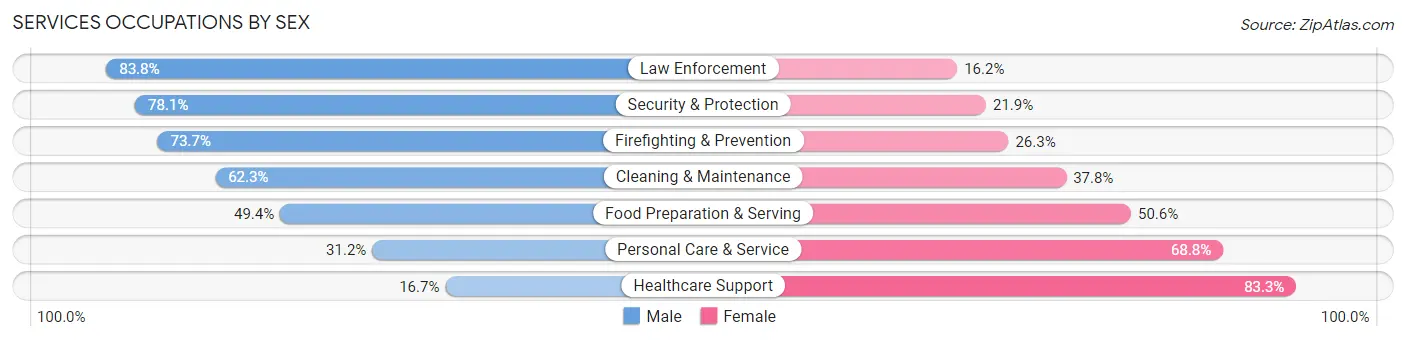
| Occupation | Male | Female |
| Healthcare Support | 1,872 (16.7%) | 9,331 (83.3%) |
| Security & Protection | 7,793 (78.1%) | 2,183 (21.9%) |
| Firefighting & Prevention | 4,126 (73.7%) | 1,475 (26.3%) |
| Law Enforcement | 3,667 (83.8%) | 708 (16.2%) |
| Food Preparation & Serving | 8,619 (49.4%) | 8,825 (50.6%) |
| Cleaning & Maintenance | 7,807 (62.3%) | 4,734 (37.8%) |
| Personal Care & Service | 3,027 (31.2%) | 6,682 (68.8%) |
| Total (Category) | 29,118 (47.8%) | 31,755 (52.2%) |
| Total (Overall) | 181,982 (53.7%) | 156,748 (46.3%) |
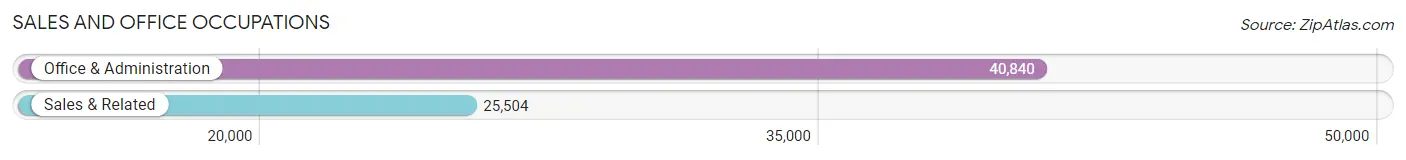
Sales and Office Occupations
The most common Sales and Office occupations in Area Code 907 are Office & Administration (40,840 | 12.1%), and Sales & Related (25,504 | 7.5%).
Sales and Office Occupations by Sex
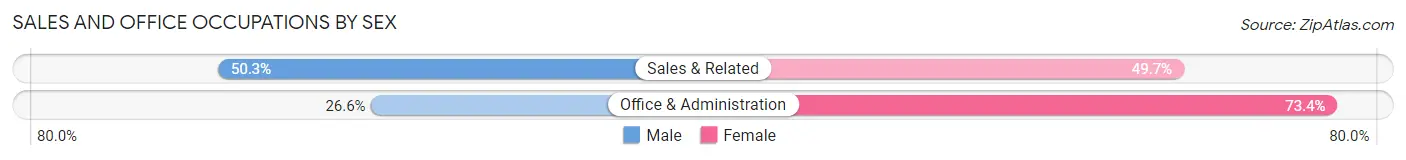
| Occupation | Male | Female |
| Sales & Related | 12,818 (50.3%) | 12,686 (49.7%) |
| Office & Administration | 10,879 (26.6%) | 29,961 (73.4%) |
| Total (Category) | 23,697 (35.7%) | 42,647 (64.3%) |
| Total (Overall) | 181,982 (53.7%) | 156,748 (46.3%) |
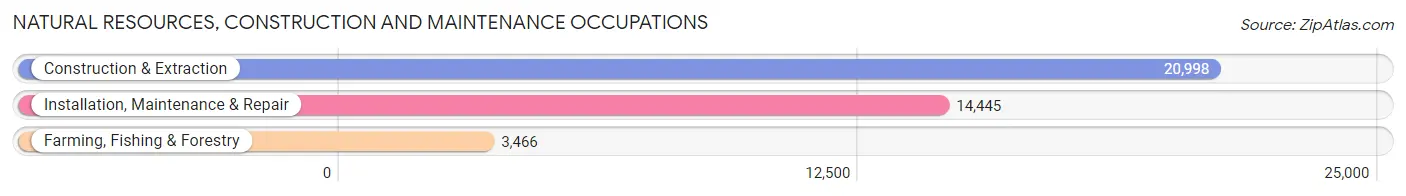
Natural Resources, Construction and Maintenance Occupations
The most common Natural Resources, Construction and Maintenance occupations in Area Code 907 are Construction & Extraction (20,998 | 6.2%), Installation, Maintenance & Repair (14,445 | 4.3%), and Farming, Fishing & Forestry (3,466 | 1.0%).
Natural Resources, Construction and Maintenance Occupations by Sex
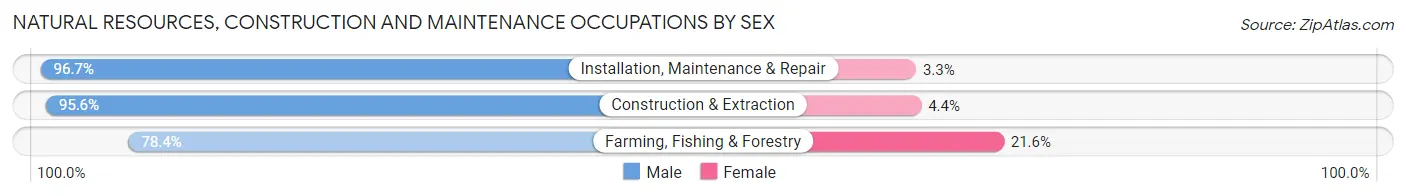
| Occupation | Male | Female |
| Farming, Fishing & Forestry | 2,717 (78.4%) | 749 (21.6%) |
| Construction & Extraction | 20,068 (95.6%) | 930 (4.4%) |
| Installation, Maintenance & Repair | 13,962 (96.7%) | 483 (3.3%) |
| Total (Category) | 36,747 (94.4%) | 2,162 (5.6%) |
| Total (Overall) | 181,982 (53.7%) | 156,748 (46.3%) |
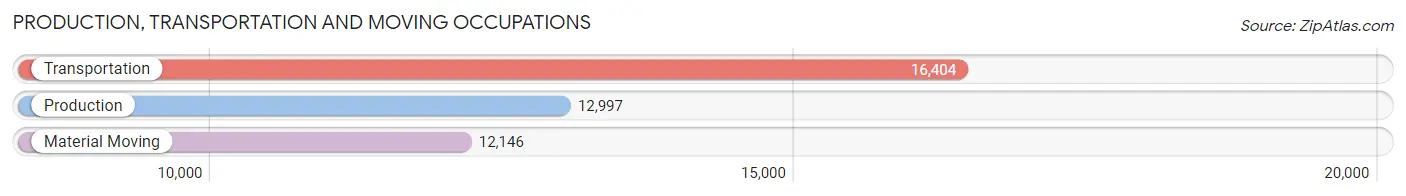
Production, Transportation and Moving Occupations
The most common Production, Transportation and Moving occupations in Area Code 907 are Transportation (16,404 | 4.8%), Production (12,997 | 3.8%), and Material Moving (12,146 | 3.6%).
Production, Transportation and Moving Occupations by Sex
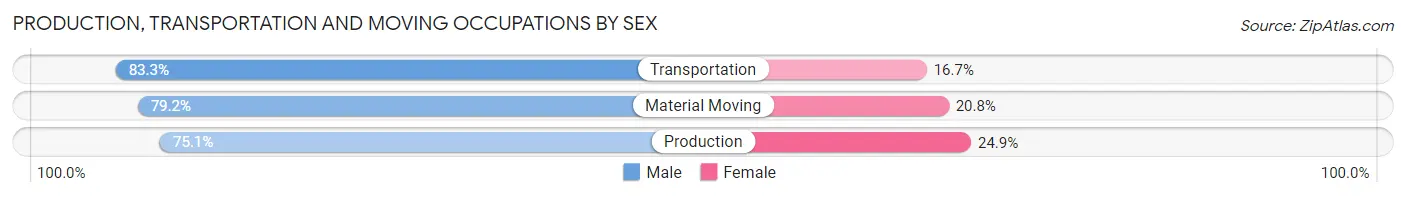
| Occupation | Male | Female |
| Production | 9,765 (75.1%) | 3,232 (24.9%) |
| Transportation | 13,660 (83.3%) | 2,744 (16.7%) |
| Material Moving | 9,625 (79.2%) | 2,521 (20.8%) |
| Total (Category) | 33,050 (79.5%) | 8,497 (20.4%) |
| Total (Overall) | 181,982 (53.7%) | 156,748 (46.3%) |
Employment Industries by Sex in Area Code 907
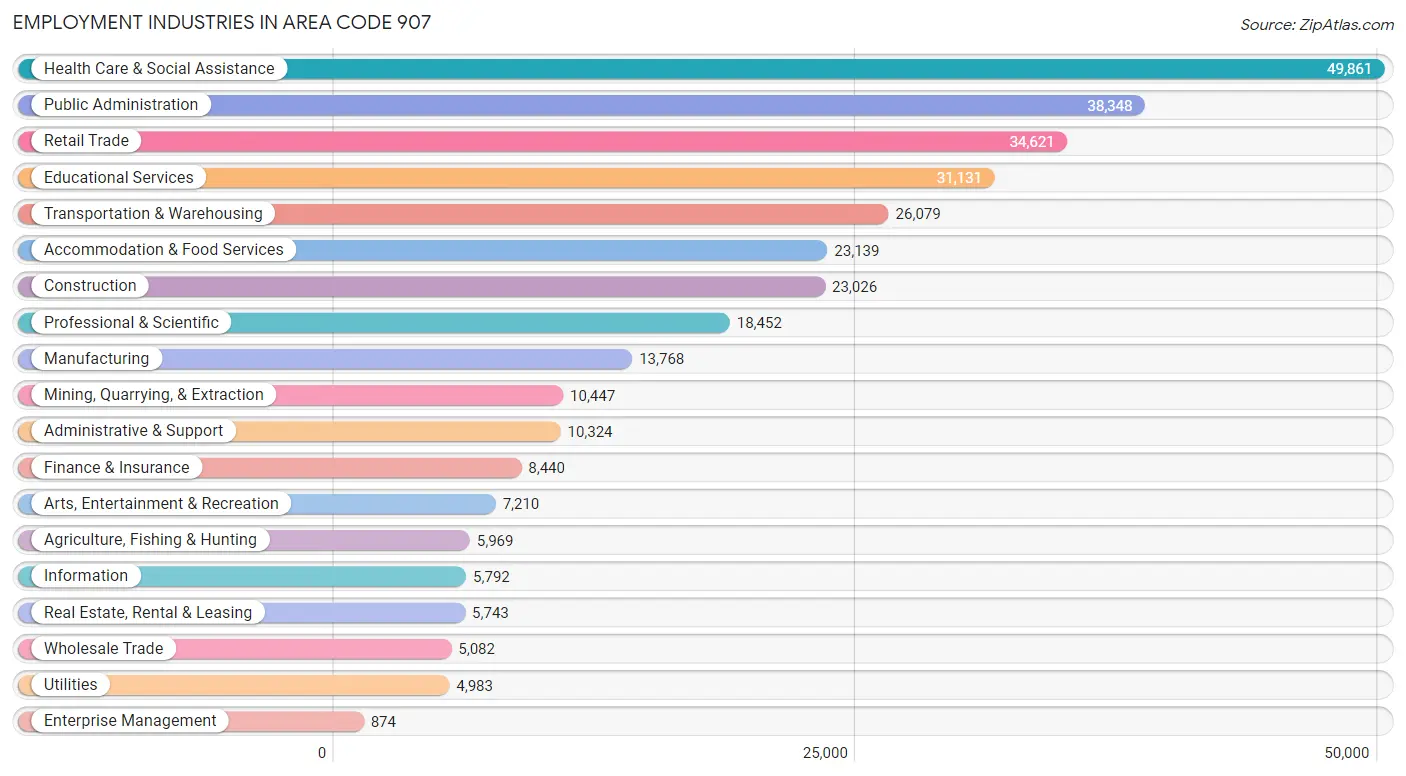
Employment Industries in Area Code 907
The major employment industries in Area Code 907 include Health Care & Social Assistance (49,861 | 14.7%), Public Administration (38,348 | 11.3%), Retail Trade (34,621 | 10.2%), Educational Services (31,131 | 9.2%), and Transportation & Warehousing (26,079 | 7.7%).
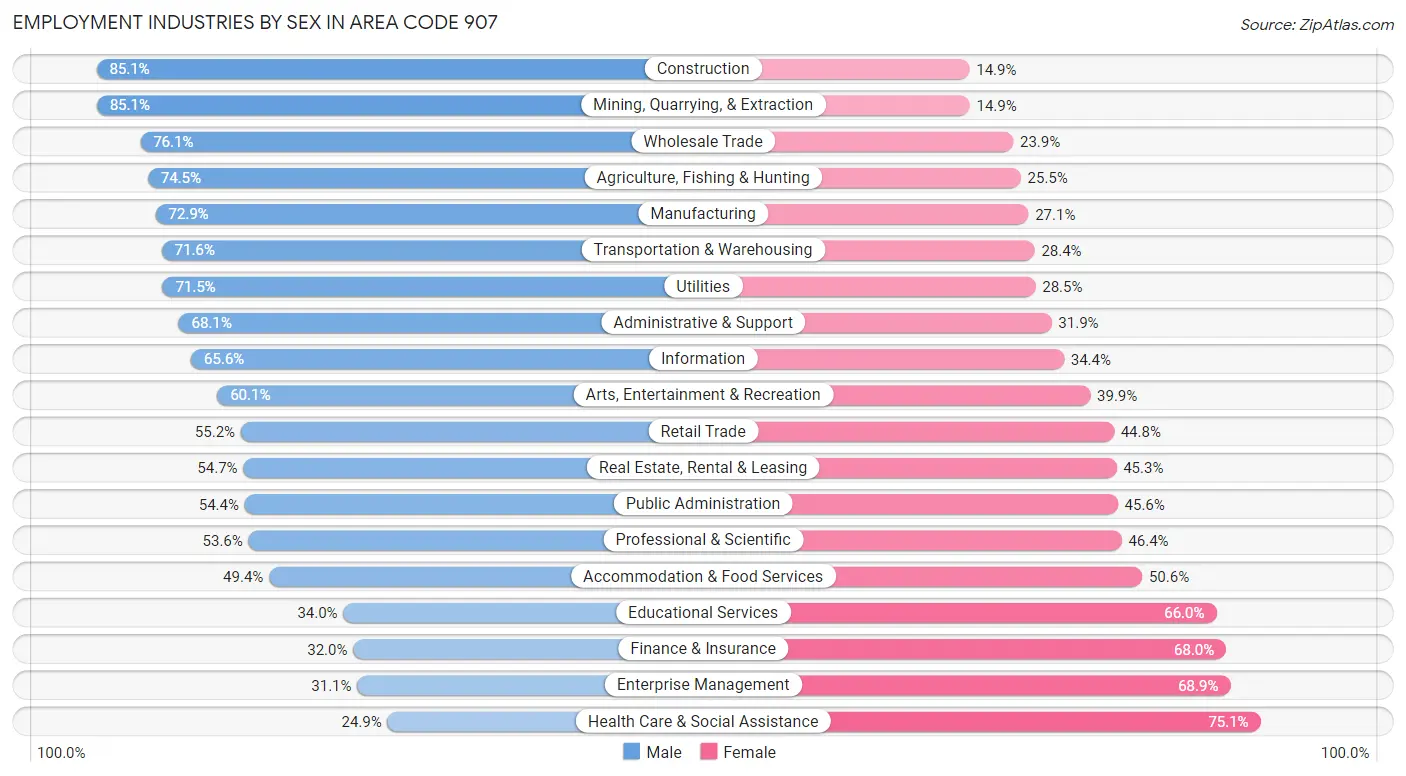
Employment Industries by Sex in Area Code 907
The Area Code 907 industries that see more men than women are Construction (85.1%), Mining, Quarrying, & Extraction (85.1%), and Wholesale Trade (76.1%), whereas the industries that tend to have a higher number of women are Health Care & Social Assistance (75.1%), Enterprise Management (68.9%), and Finance & Insurance (68.0%).
| Industry | Male | Female |
| Agriculture, Fishing & Hunting | 4,447 (74.5%) | 1,522 (25.5%) |
| Mining, Quarrying, & Extraction | 8,887 (85.1%) | 1,560 (14.9%) |
| Construction | 19,600 (85.1%) | 3,426 (14.9%) |
| Manufacturing | 10,040 (72.9%) | 3,728 (27.1%) |
| Wholesale Trade | 3,866 (76.1%) | 1,216 (23.9%) |
| Retail Trade | 19,120 (55.2%) | 15,501 (44.8%) |
| Transportation & Warehousing | 18,682 (71.6%) | 7,397 (28.4%) |
| Utilities | 3,561 (71.5%) | 1,422 (28.5%) |
| Information | 3,798 (65.6%) | 1,994 (34.4%) |
| Finance & Insurance | 2,698 (32.0%) | 5,742 (68.0%) |
| Real Estate, Rental & Leasing | 3,142 (54.7%) | 2,601 (45.3%) |
| Professional & Scientific | 9,896 (53.6%) | 8,556 (46.4%) |
| Enterprise Management | 272 (31.1%) | 602 (68.9%) |
| Administrative & Support | 7,034 (68.1%) | 3,290 (31.9%) |
| Educational Services | 10,583 (34.0%) | 20,548 (66.0%) |
| Health Care & Social Assistance | 12,400 (24.9%) | 37,461 (75.1%) |
| Arts, Entertainment & Recreation | 4,335 (60.1%) | 2,875 (39.9%) |
| Accommodation & Food Services | 11,425 (49.4%) | 11,714 (50.6%) |
| Public Administration | 20,873 (54.4%) | 17,475 (45.6%) |
| Total | 181,982 (53.7%) | 156,748 (46.3%) |
Education in Area Code 907
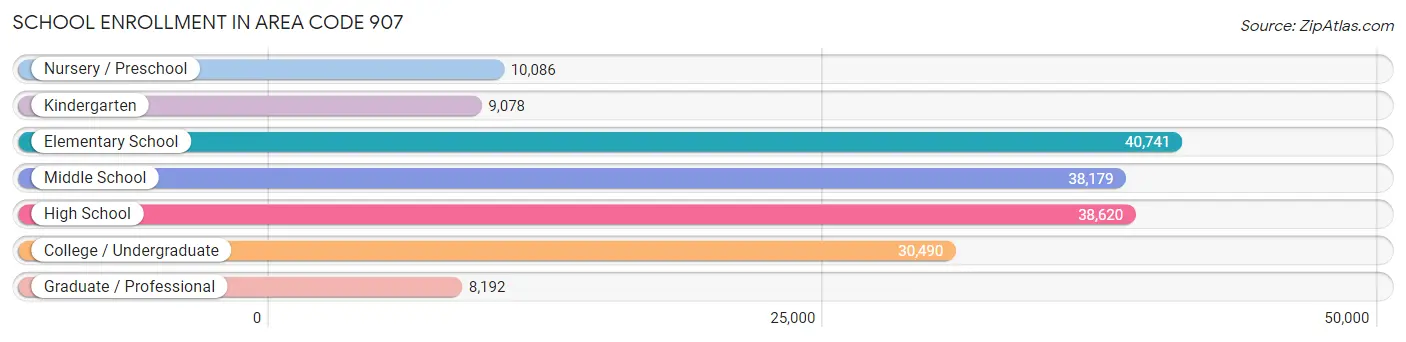
School Enrollment in Area Code 907
The most common levels of schooling among the 175,386 students in Area Code 907 are elementary school (40,741 | 23.2%), high school (38,620 | 22.0%), and middle school (38,179 | 21.8%).
| School Level | # Students | % Students |
| Nursery / Preschool | 10,086 | 5.8% |
| Kindergarten | 9,078 | 5.2% |
| Elementary School | 40,741 | 23.2% |
| Middle School | 38,179 | 21.8% |
| High School | 38,620 | 22.0% |
| College / Undergraduate | 30,490 | 17.4% |
| Graduate / Professional | 8,192 | 4.7% |
| Total | 175,386 | 100.0% |
School Enrollment by Age by Funding Source in Area Code 907
Out of a total of 175,386 students who are enrolled in schools in Area Code 907, 27,338 (15.6%) attend a private institution, while the remaining 148,048 (84.4%) are enrolled in public schools. The age group of 3 to 4 year olds has the highest likelihood of being enrolled in private schools, with 2,904 (38.5% in the age bracket) enrolled. Conversely, the age group of 15 to 17 year olds has the lowest likelihood of being enrolled in a private school, with 24,731 (88.4% in the age bracket) attending a public institution.
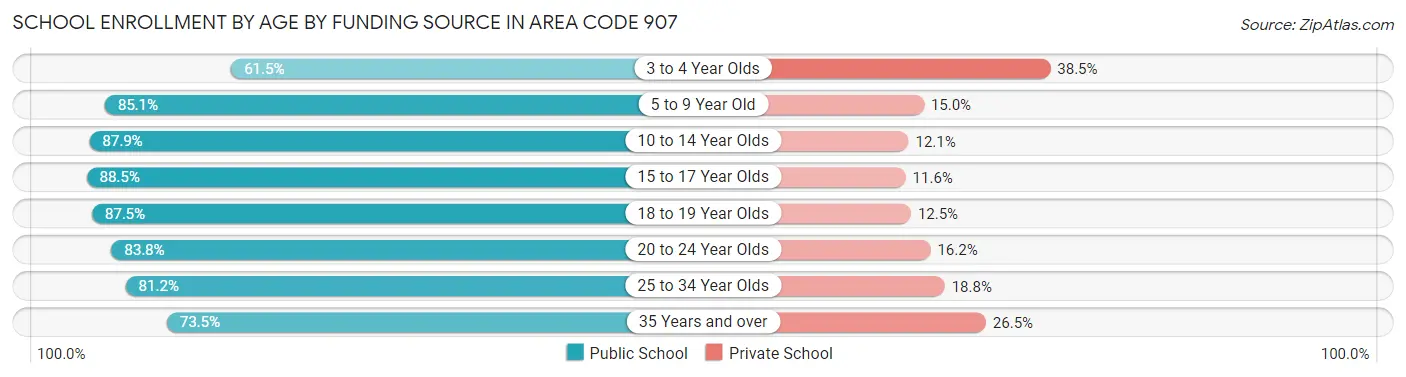
| Age Bracket | Public School | Private School |
| 3 to 4 Year Olds | 4,639 (61.5%) | 2,904 (38.5%) |
| 5 to 9 Year Old | 40,671 (85.1%) | 7,149 (14.9%) |
| 10 to 14 Year Olds | 41,989 (87.9%) | 5,767 (12.1%) |
| 15 to 17 Year Olds | 24,731 (88.4%) | 3,229 (11.6%) |
| 18 to 19 Year Olds | 8,416 (87.5%) | 1,206 (12.5%) |
| 20 to 24 Year Olds | 9,475 (83.8%) | 1,828 (16.2%) |
| 25 to 34 Year Olds | 9,891 (81.2%) | 2,295 (18.8%) |
| 35 Years and over | 8,230 (73.5%) | 2,966 (26.5%) |
| Total | 148,048 (84.4%) | 27,338 (15.6%) |
Educational Attainment by Field of Study in Area Code 907
Business (22,675 | 14.0%), education (21,064 | 13.0%), bio, nature & agricultural (17,090 | 10.5%), science & technology (16,956 | 10.4%), and social sciences (13,183 | 8.1%) are the most common fields of study among 162,317 individuals in Area Code 907 who have obtained a bachelor's degree or higher.
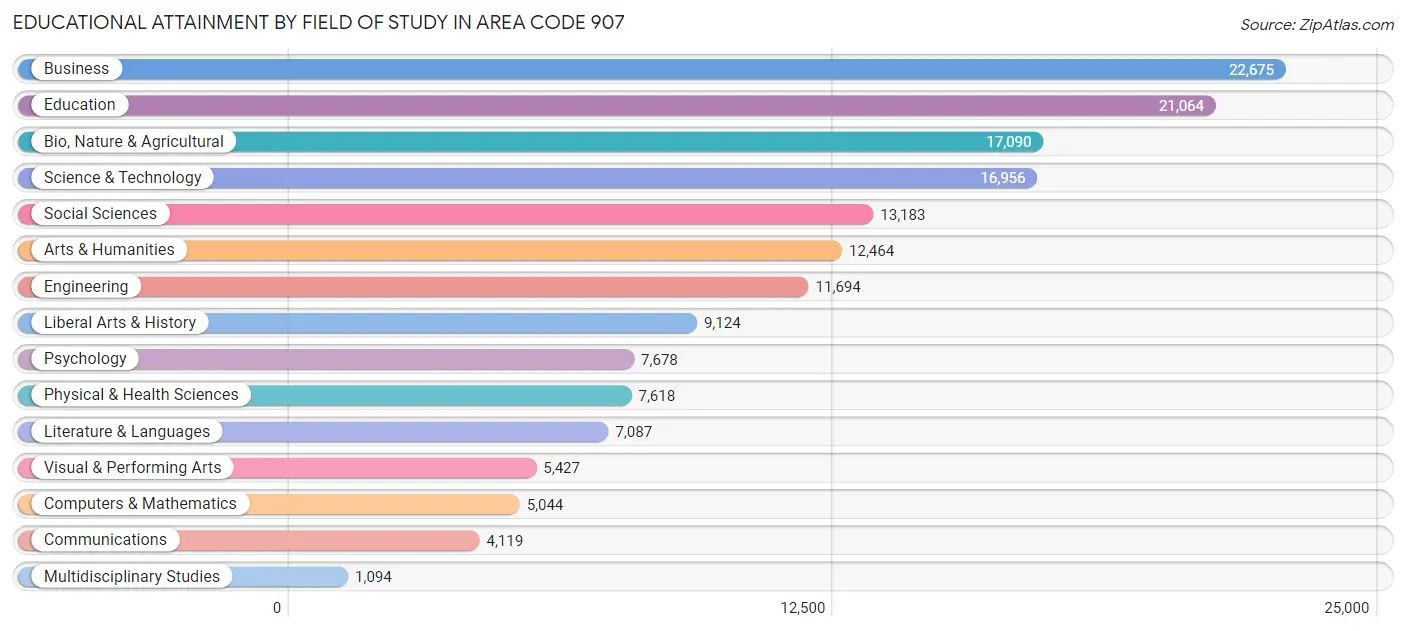
| Field of Study | # Graduates | % Graduates |
| Computers & Mathematics | 5,044 | 3.1% |
| Bio, Nature & Agricultural | 17,090 | 10.5% |
| Physical & Health Sciences | 7,618 | 4.7% |
| Psychology | 7,678 | 4.7% |
| Social Sciences | 13,183 | 8.1% |
| Engineering | 11,694 | 7.2% |
| Multidisciplinary Studies | 1,094 | 0.7% |
| Science & Technology | 16,956 | 10.4% |
| Business | 22,675 | 14.0% |
| Education | 21,064 | 13.0% |
| Literature & Languages | 7,087 | 4.4% |
| Liberal Arts & History | 9,124 | 5.6% |
| Visual & Performing Arts | 5,427 | 3.3% |
| Communications | 4,119 | 2.5% |
| Arts & Humanities | 12,464 | 7.7% |
| Total | 162,317 | 100.0% |
Transportation & Commute in Area Code 907
Vehicle Availability by Sex in Area Code 907
The most prevalent vehicle ownership categories in Area Code 907 are males with 2 vehicles (72,792, accounting for 40.3%) and females with 2 vehicles (58,202, making up 48.1%).
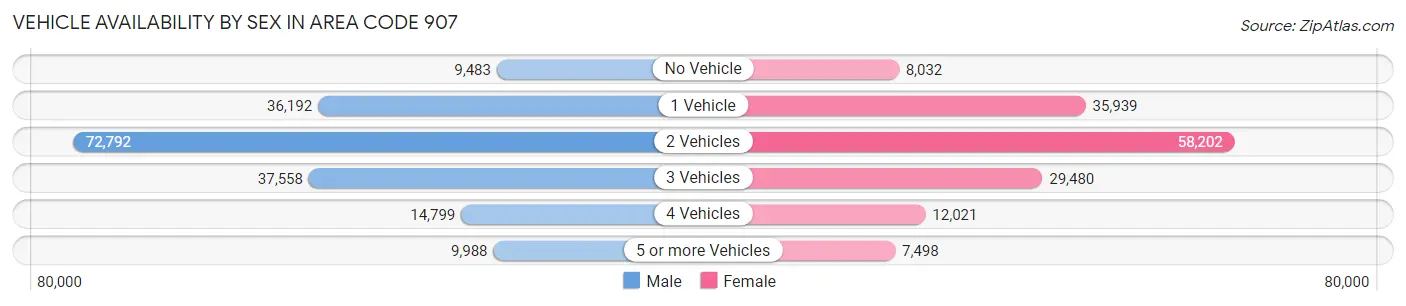
| Vehicles Available | Male | Female |
| No Vehicle | 9,483 (5.2%) | 8,032 (5.3%) |
| 1 Vehicle | 36,192 (20.0%) | 35,939 (23.8%) |
| 2 Vehicles | 72,792 (40.3%) | 58,202 (38.5%) |
| 3 Vehicles | 37,558 (20.8%) | 29,480 (19.5%) |
| 4 Vehicles | 14,799 (8.2%) | 12,021 (8.0%) |
| 5 or more Vehicles | 9,988 (5.5%) | 7,498 (5.0%) |
| Total | 180,812 (100.0%) | 151,172 (100.0%) |
Commute Time in Area Code 907
The most frequently occuring commute durations in Area Code 907 are 15 to 19 minutes (62,104 commuters, 19.3%), 10 to 14 minutes (61,140 commuters, 19.0%), and 5 to 9 minutes (56,522 commuters, 17.5%).
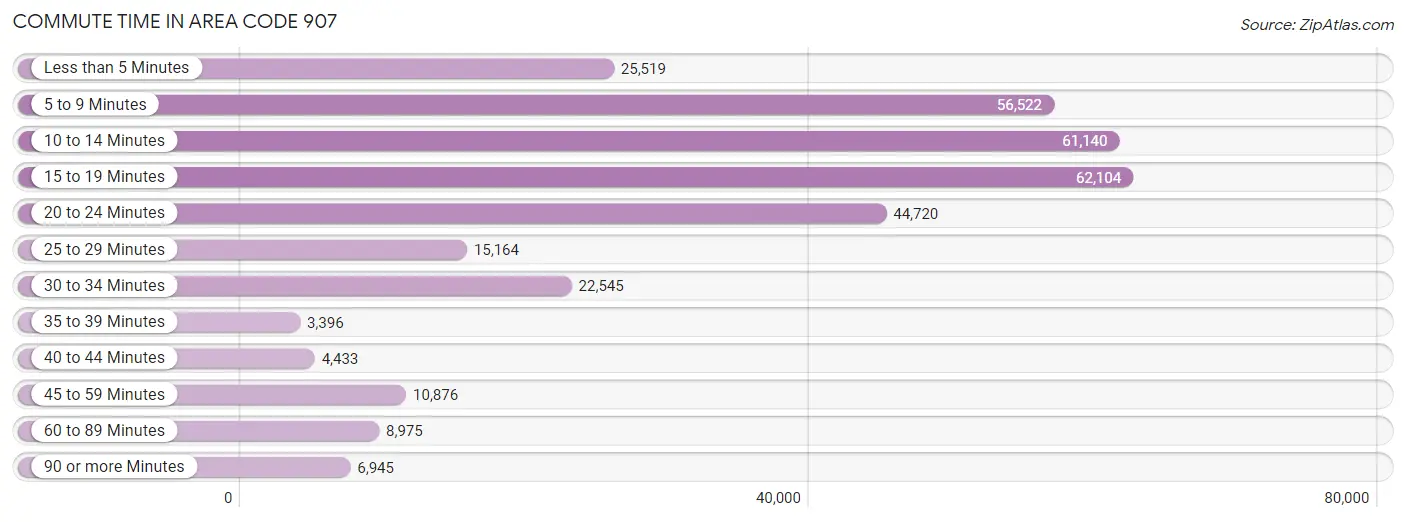
| Commute Time | # Commuters | % Commuters |
| Less than 5 Minutes | 25,519 | 7.9% |
| 5 to 9 Minutes | 56,522 | 17.5% |
| 10 to 14 Minutes | 61,140 | 19.0% |
| 15 to 19 Minutes | 62,104 | 19.3% |
| 20 to 24 Minutes | 44,720 | 13.9% |
| 25 to 29 Minutes | 15,164 | 4.7% |
| 30 to 34 Minutes | 22,545 | 7.0% |
| 35 to 39 Minutes | 3,396 | 1.1% |
| 40 to 44 Minutes | 4,433 | 1.4% |
| 45 to 59 Minutes | 10,876 | 3.4% |
| 60 to 89 Minutes | 8,975 | 2.8% |
| 90 or more Minutes | 6,945 | 2.1% |
Commute Time by Sex in Area Code 907
The most common commute times in Area Code 907 are 15 to 19 minutes (34,076 commuters, 18.6%) for males and 15 to 19 minutes (28,028 commuters, 20.2%) for females.
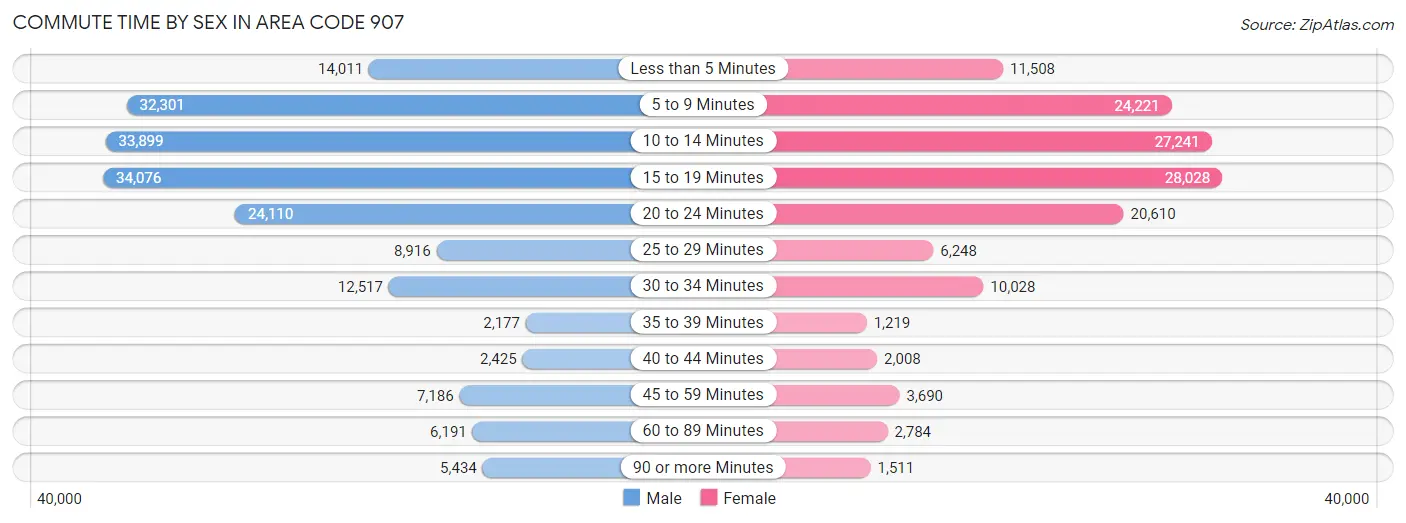
| Commute Time | Male | Female |
| Less than 5 Minutes | 14,011 (7.6%) | 11,508 (8.3%) |
| 5 to 9 Minutes | 32,301 (17.6%) | 24,221 (17.4%) |
| 10 to 14 Minutes | 33,899 (18.5%) | 27,241 (19.6%) |
| 15 to 19 Minutes | 34,076 (18.6%) | 28,028 (20.2%) |
| 20 to 24 Minutes | 24,110 (13.2%) | 20,610 (14.8%) |
| 25 to 29 Minutes | 8,916 (4.9%) | 6,248 (4.5%) |
| 30 to 34 Minutes | 12,517 (6.8%) | 10,028 (7.2%) |
| 35 to 39 Minutes | 2,177 (1.2%) | 1,219 (0.9%) |
| 40 to 44 Minutes | 2,425 (1.3%) | 2,008 (1.4%) |
| 45 to 59 Minutes | 7,186 (3.9%) | 3,690 (2.6%) |
| 60 to 89 Minutes | 6,191 (3.4%) | 2,784 (2.0%) |
| 90 or more Minutes | 5,434 (3.0%) | 1,511 (1.1%) |
Time of Departure to Work by Sex in Area Code 907
The most frequent times of departure to work in Area Code 907 are 7:30 AM to 7:59 AM (25,867, 14.1%) for males and 7:30 AM to 7:59 AM (26,827, 19.3%) for females.
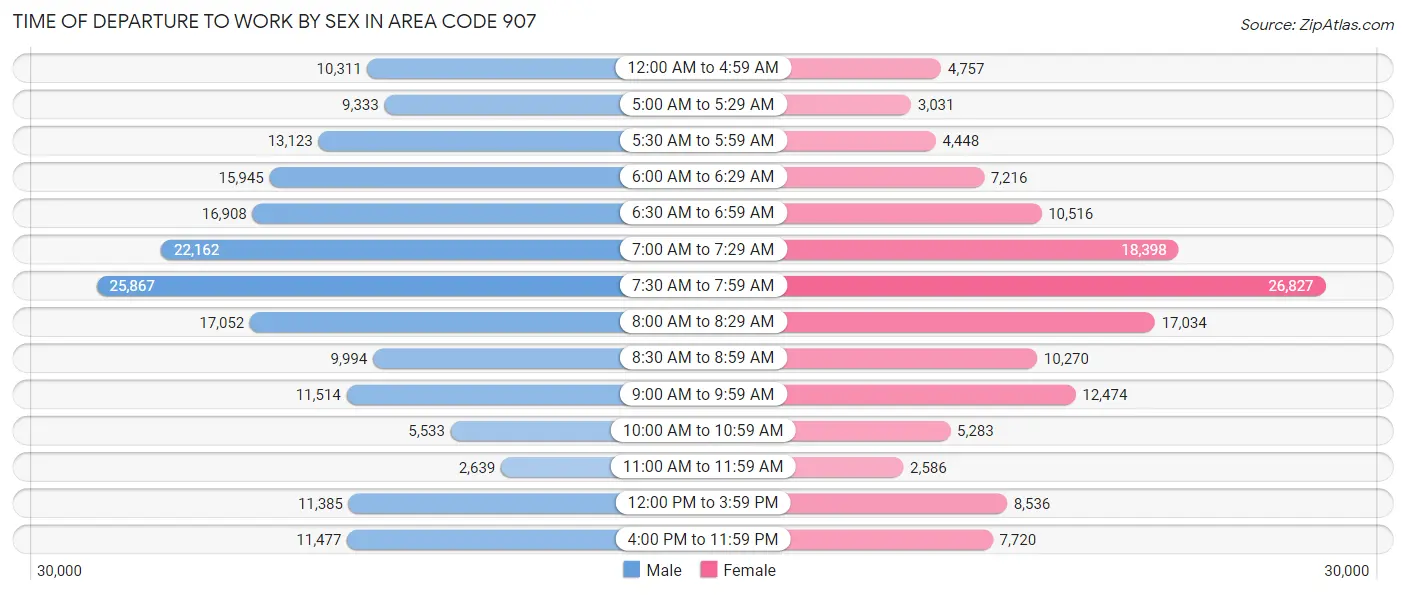
| Time of Departure | Male | Female |
| 12:00 AM to 4:59 AM | 10,311 (5.6%) | 4,757 (3.4%) |
| 5:00 AM to 5:29 AM | 9,333 (5.1%) | 3,031 (2.2%) |
| 5:30 AM to 5:59 AM | 13,123 (7.2%) | 4,448 (3.2%) |
| 6:00 AM to 6:29 AM | 15,945 (8.7%) | 7,216 (5.2%) |
| 6:30 AM to 6:59 AM | 16,908 (9.2%) | 10,516 (7.6%) |
| 7:00 AM to 7:29 AM | 22,162 (12.1%) | 18,398 (13.2%) |
| 7:30 AM to 7:59 AM | 25,867 (14.1%) | 26,827 (19.3%) |
| 8:00 AM to 8:29 AM | 17,052 (9.3%) | 17,034 (12.2%) |
| 8:30 AM to 8:59 AM | 9,994 (5.4%) | 10,270 (7.4%) |
| 9:00 AM to 9:59 AM | 11,514 (6.3%) | 12,474 (9.0%) |
| 10:00 AM to 10:59 AM | 5,533 (3.0%) | 5,283 (3.8%) |
| 11:00 AM to 11:59 AM | 2,639 (1.4%) | 2,586 (1.9%) |
| 12:00 PM to 3:59 PM | 11,385 (6.2%) | 8,536 (6.1%) |
| 4:00 PM to 11:59 PM | 11,477 (6.3%) | 7,720 (5.6%) |
| Total | 183,243 (100.0%) | 139,096 (100.0%) |
Housing Occupancy in Area Code 907
Occupancy by Ownership in Area Code 907
Of the total 264,362 dwellings in Area Code 907, owner-occupied units account for 175,198 (66.3%), while renter-occupied units make up 89,164 (33.7%).
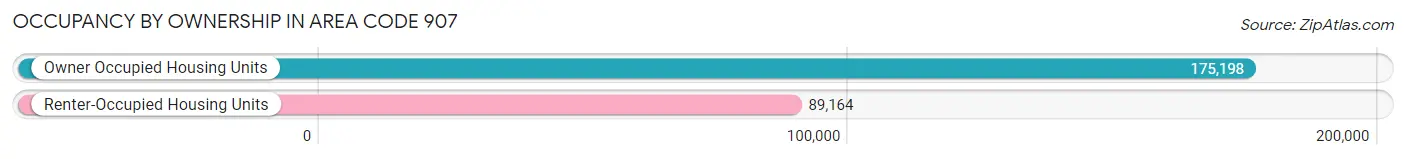
| Occupancy | # Housing Units | % Housing Units |
| Owner Occupied Housing Units | 175,198 | 66.3% |
| Renter-Occupied Housing Units | 89,164 | 33.7% |
| Total Occupied Housing Units | 264,362 | 100.0% |
Occupancy by Household Size in Area Code 907
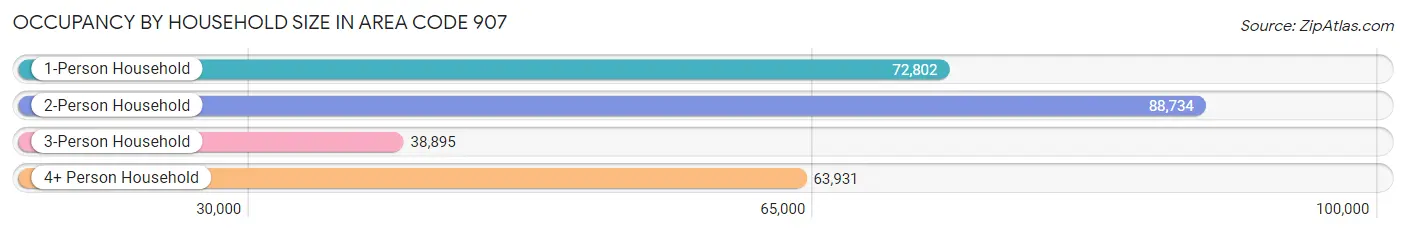
| Household Size | # Housing Units | % Housing Units |
| 1-Person Household | 72,802 | 27.5% |
| 2-Person Household | 88,734 | 33.6% |
| 3-Person Household | 38,895 | 14.7% |
| 4+ Person Household | 63,931 | 24.2% |
| Total Housing Units | 264,362 | 100.0% |
Occupancy by Ownership by Household Size in Area Code 907
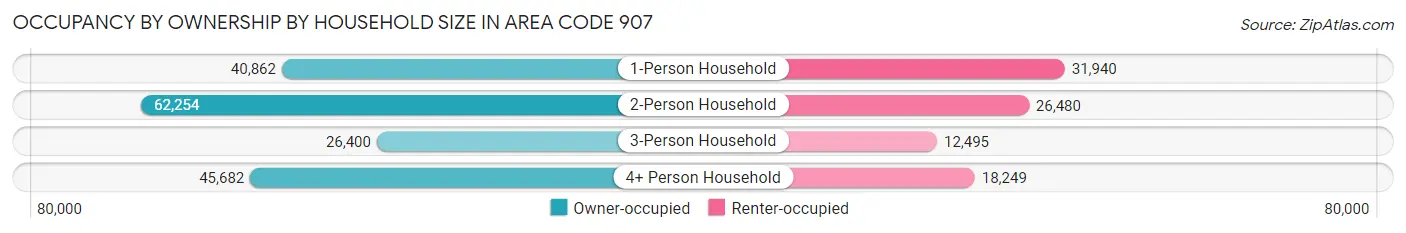
| Household Size | Owner-occupied | Renter-occupied |
| 1-Person Household | 40,862 (56.1%) | 31,940 (43.9%) |
| 2-Person Household | 62,254 (70.2%) | 26,480 (29.8%) |
| 3-Person Household | 26,400 (67.9%) | 12,495 (32.1%) |
| 4+ Person Household | 45,682 (71.5%) | 18,249 (28.5%) |
| Total Housing Units | 175,198 (66.3%) | 89,164 (33.7%) |
Occupancy by Educational Attainment in Area Code 907
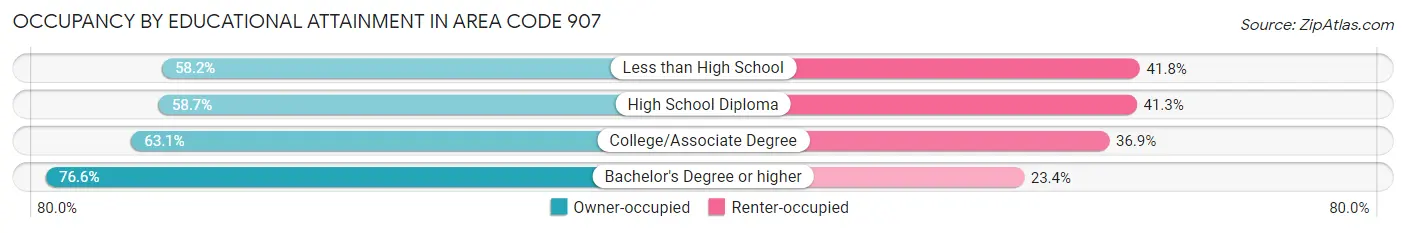
| Household Size | Owner-occupied | Renter-occupied |
| Less than High School | 8,098 (58.2%) | 5,813 (41.8%) |
| High School Diploma | 37,705 (58.7%) | 26,524 (41.3%) |
| College/Associate Degree | 61,681 (63.1%) | 36,129 (36.9%) |
| Bachelor's Degree or higher | 67,714 (76.6%) | 20,698 (23.4%) |
Occupancy by Age of Householder in Area Code 907
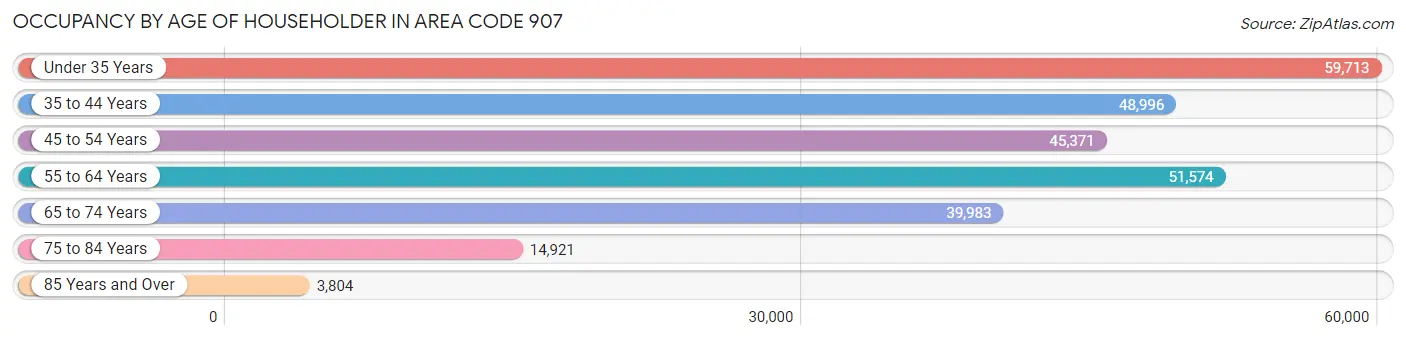
| Age Bracket | # Households | % Households |
| Under 35 Years | 59,713 | 22.6% |
| 35 to 44 Years | 48,996 | 18.5% |
| 45 to 54 Years | 45,371 | 17.2% |
| 55 to 64 Years | 51,574 | 19.5% |
| 65 to 74 Years | 39,983 | 15.1% |
| 75 to 84 Years | 14,921 | 5.6% |
| 85 Years and Over | 3,804 | 1.4% |
| Total | 264,362 | 100.0% |
Housing Finances in Area Code 907
Median Income by Occupancy in Area Code 907
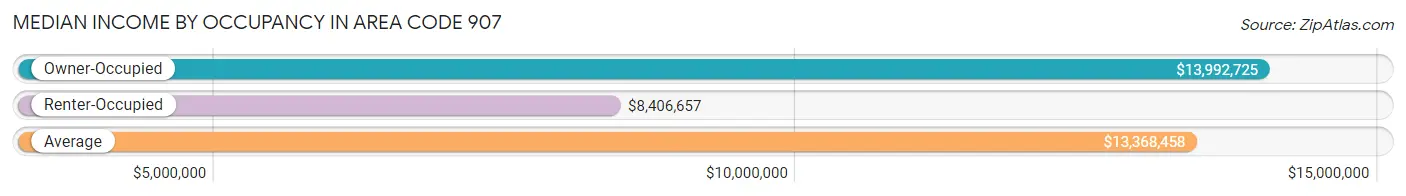
| Occupancy Type | # Households | Median Income |
| Owner-Occupied | 175,198 (66.3%) | $13,992,725 |
| Renter-Occupied | 89,164 (33.7%) | $8,406,657 |
| Average | 264,362 (100.0%) | $13,368,458 |
Occupancy by Householder Income Bracket in Area Code 907
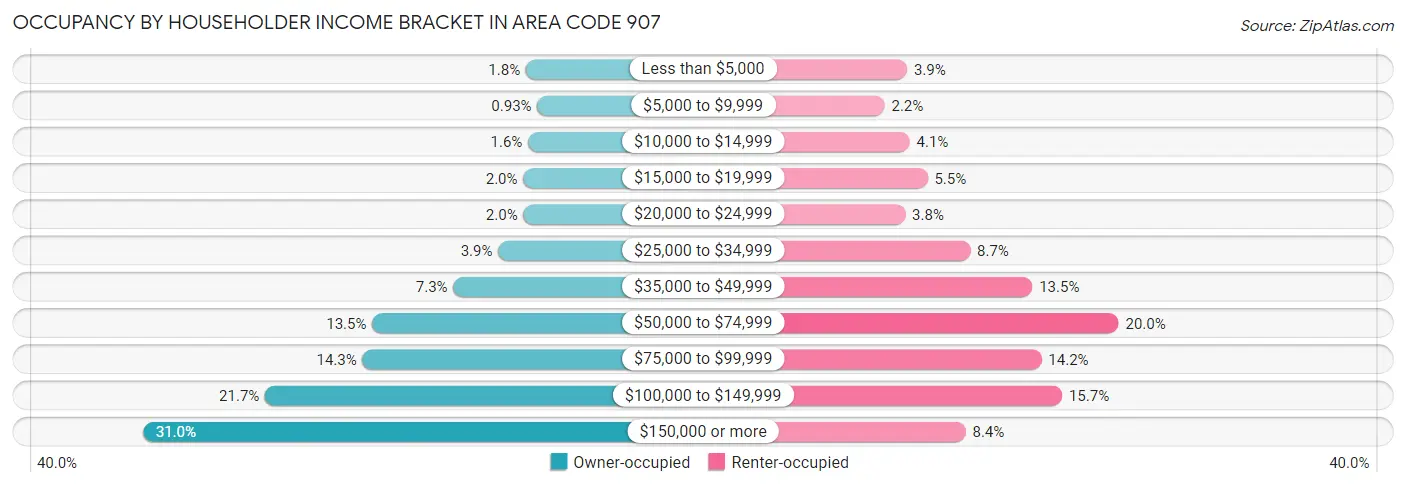
| Income Bracket | Owner-occupied | Renter-occupied |
| Less than $5,000 | 3,146 (1.8%) | 3,492 (3.9%) |
| $5,000 to $9,999 | 1,624 (0.9%) | 1,970 (2.2%) |
| $10,000 to $14,999 | 2,858 (1.6%) | 3,674 (4.1%) |
| $15,000 to $19,999 | 3,510 (2.0%) | 4,886 (5.5%) |
| $20,000 to $24,999 | 3,478 (2.0%) | 3,371 (3.8%) |
| $25,000 to $34,999 | 6,852 (3.9%) | 7,786 (8.7%) |
| $35,000 to $49,999 | 12,836 (7.3%) | 11,998 (13.5%) |
| $50,000 to $74,999 | 23,674 (13.5%) | 17,868 (20.0%) |
| $75,000 to $99,999 | 24,968 (14.2%) | 12,622 (14.2%) |
| $100,000 to $149,999 | 37,966 (21.7%) | 14,022 (15.7%) |
| $150,000 or more | 54,286 (31.0%) | 7,475 (8.4%) |
| Total | 175,198 (100.0%) | 89,164 (100.0%) |
Monthly Housing Cost Tiers in Area Code 907
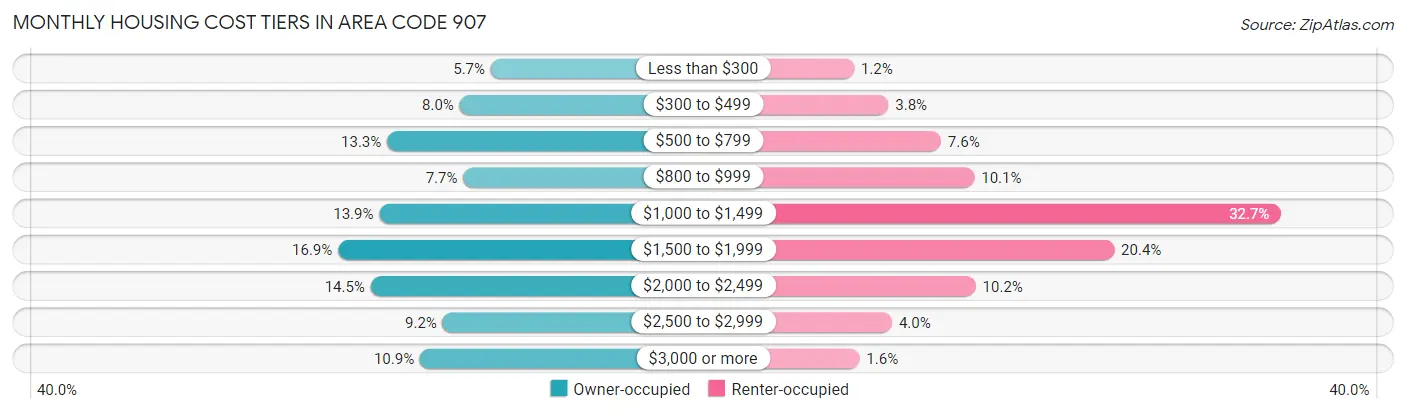
| Monthly Cost | Owner-occupied | Renter-occupied |
| Less than $300 | 9,915 (5.7%) | 1,086 (1.2%) |
| $300 to $499 | 13,945 (8.0%) | 3,342 (3.7%) |
| $500 to $799 | 23,305 (13.3%) | 6,790 (7.6%) |
| $800 to $999 | 13,480 (7.7%) | 8,991 (10.1%) |
| $1,000 to $1,499 | 24,323 (13.9%) | 29,138 (32.7%) |
| $1,500 to $1,999 | 29,618 (16.9%) | 18,169 (20.4%) |
| $2,000 to $2,499 | 25,415 (14.5%) | 9,081 (10.2%) |
| $2,500 to $2,999 | 16,129 (9.2%) | 3,584 (4.0%) |
| $3,000 or more | 19,068 (10.9%) | 1,443 (1.6%) |
| Total | 175,198 (100.0%) | 89,164 (100.0%) |
Physical Housing Characteristics in Area Code 907
Housing Structures in Area Code 907
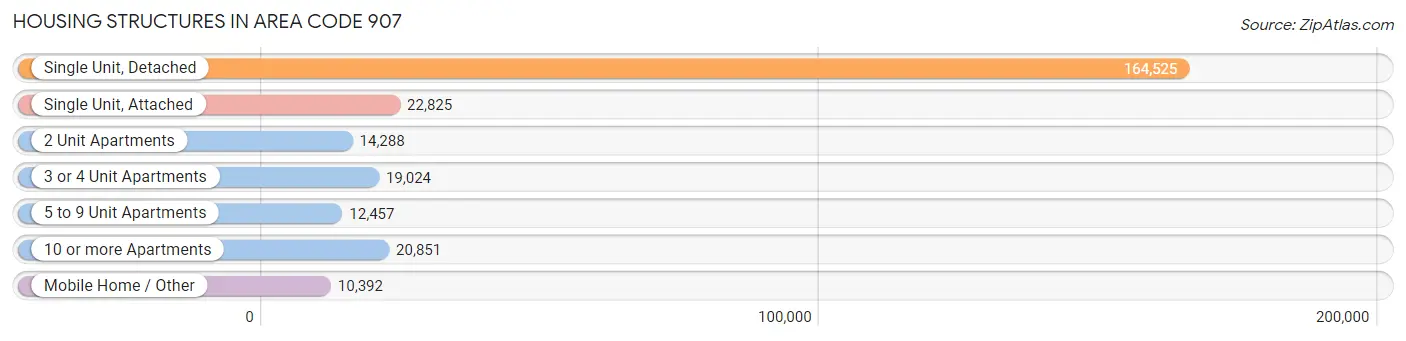
| Structure Type | # Housing Units | % Housing Units |
| Single Unit, Detached | 164,525 | 62.2% |
| Single Unit, Attached | 22,825 | 8.6% |
| 2 Unit Apartments | 14,288 | 5.4% |
| 3 or 4 Unit Apartments | 19,024 | 7.2% |
| 5 to 9 Unit Apartments | 12,457 | 4.7% |
| 10 or more Apartments | 20,851 | 7.9% |
| Mobile Home / Other | 10,392 | 3.9% |
| Total | 264,362 | 100.0% |
Housing Structures by Occupancy in Area Code 907
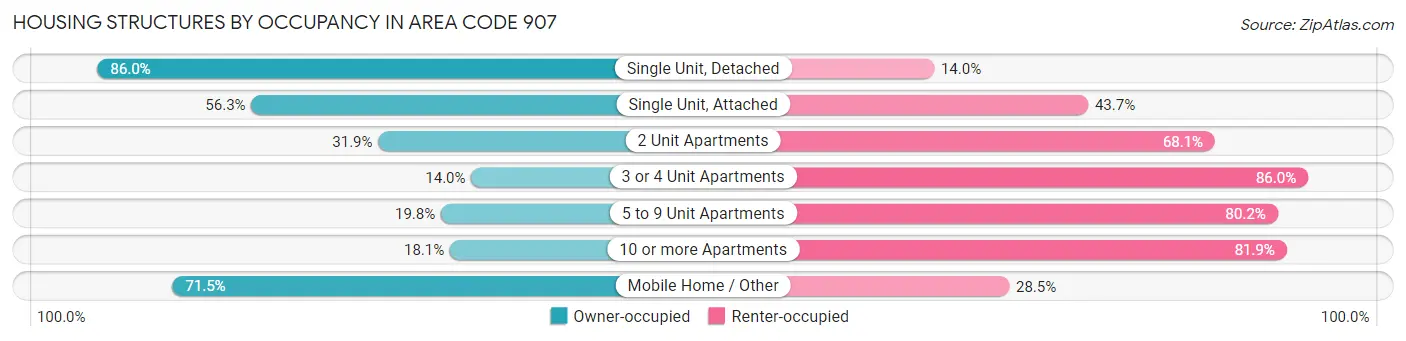
| Structure Type | Owner-occupied | Renter-occupied |
| Single Unit, Detached | 141,454 (86.0%) | 23,071 (14.0%) |
| Single Unit, Attached | 12,857 (56.3%) | 9,968 (43.7%) |
| 2 Unit Apartments | 4,556 (31.9%) | 9,732 (68.1%) |
| 3 or 4 Unit Apartments | 2,660 (14.0%) | 16,364 (86.0%) |
| 5 to 9 Unit Apartments | 2,469 (19.8%) | 9,988 (80.2%) |
| 10 or more Apartments | 3,769 (18.1%) | 17,082 (81.9%) |
| Mobile Home / Other | 7,433 (71.5%) | 2,959 (28.5%) |
| Total | 175,198 (66.3%) | 89,164 (33.7%) |
Housing Structures by Number of Rooms in Area Code 907
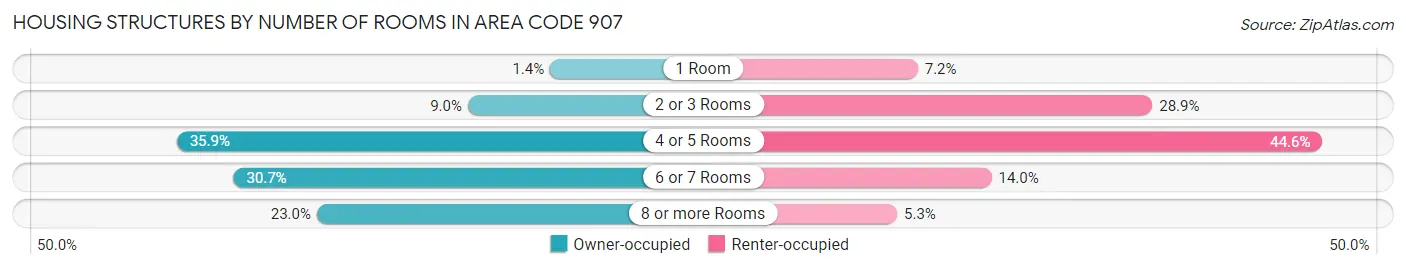
| Number of Rooms | Owner-occupied | Renter-occupied |
| 1 Room | 2,453 (1.4%) | 6,417 (7.2%) |
| 2 or 3 Rooms | 15,785 (9.0%) | 25,761 (28.9%) |
| 4 or 5 Rooms | 62,945 (35.9%) | 39,773 (44.6%) |
| 6 or 7 Rooms | 53,747 (30.7%) | 12,500 (14.0%) |
| 8 or more Rooms | 40,268 (23.0%) | 4,713 (5.3%) |
| Total | 175,198 (100.0%) | 89,164 (100.0%) |
Housing Structure by Heating Type in Area Code 907
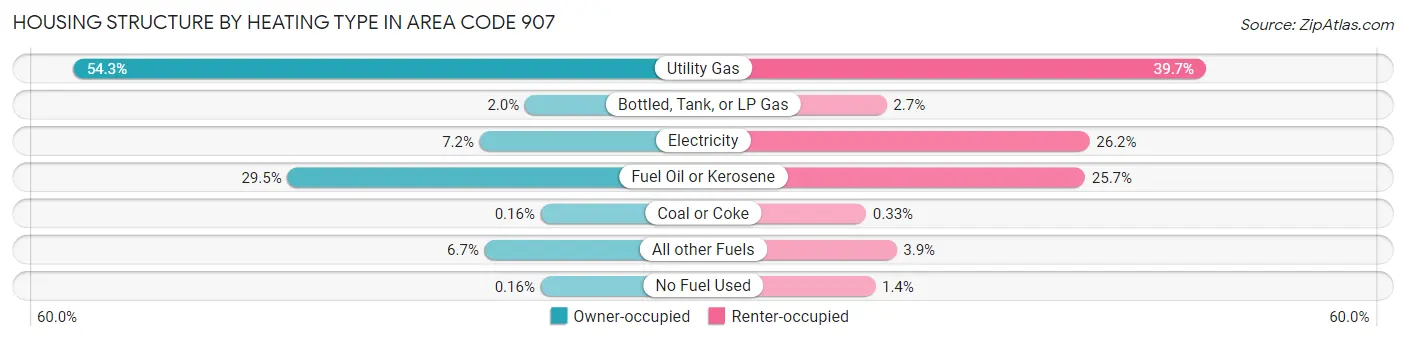
| Heating Type | Owner-occupied | Renter-occupied |
| Utility Gas | 95,132 (54.3%) | 35,437 (39.7%) |
| Bottled, Tank, or LP Gas | 3,477 (2.0%) | 2,419 (2.7%) |
| Electricity | 12,655 (7.2%) | 23,394 (26.2%) |
| Fuel Oil or Kerosene | 51,724 (29.5%) | 22,937 (25.7%) |
| Coal or Coke | 276 (0.2%) | 291 (0.3%) |
| All other Fuels | 11,652 (6.7%) | 3,446 (3.9%) |
| No Fuel Used | 282 (0.2%) | 1,240 (1.4%) |
| Total | 175,198 (100.0%) | 89,164 (100.0%) |
Household Vehicle Usage in Area Code 907
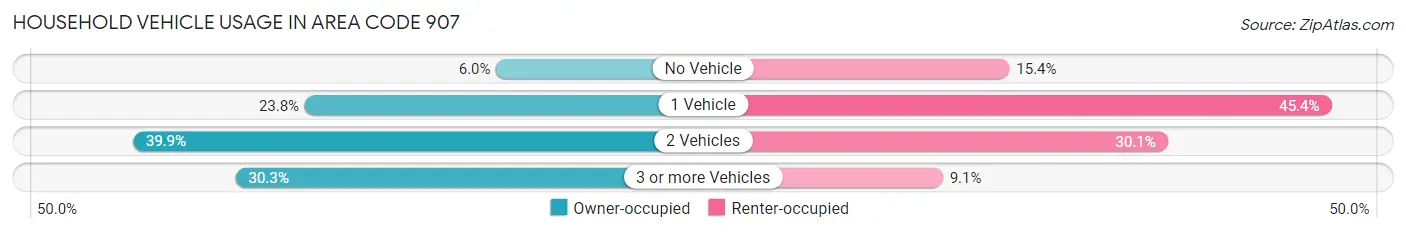
| Vehicles per Household | Owner-occupied | Renter-occupied |
| No Vehicle | 10,450 (6.0%) | 13,683 (15.3%) |
| 1 Vehicle | 41,753 (23.8%) | 40,481 (45.4%) |
| 2 Vehicles | 69,896 (39.9%) | 26,856 (30.1%) |
| 3 or more Vehicles | 53,099 (30.3%) | 8,144 (9.1%) |
| Total | 175,198 (100.0%) | 89,164 (100.0%) |
Real Estate & Mortgages in Area Code 907
Real Estate and Mortgage Overview in Area Code 907
| Characteristic | Without Mortgage | With Mortgage |
| Housing Units | 68,390 | 106,808 |
| Median Property Value | $29,250,099 | $31,769,700 |
| Median Household Income | $11,692,128 | $39,309 |
| Monthly Housing Costs | $99,236 | $18,957 |
| Real Estate Taxes | $161,612 | $9,738 |
Property Value by Mortgage Status in Area Code 907
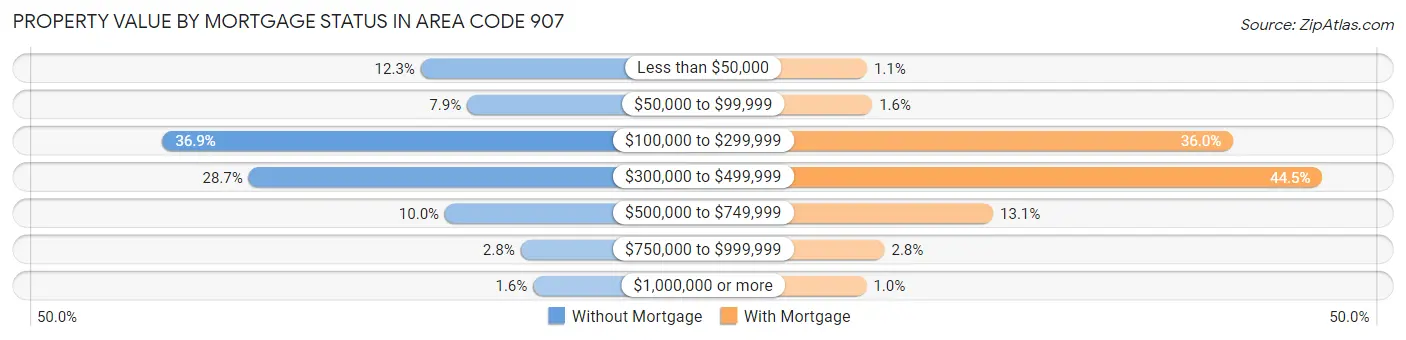
| Property Value | Without Mortgage | With Mortgage |
| Less than $50,000 | 8,401 (12.3%) | 1,167 (1.1%) |
| $50,000 to $99,999 | 5,380 (7.9%) | 1,697 (1.6%) |
| $100,000 to $299,999 | 25,216 (36.9%) | 38,413 (36.0%) |
| $300,000 to $499,999 | 19,605 (28.7%) | 47,481 (44.5%) |
| $500,000 to $749,999 | 6,821 (10.0%) | 13,991 (13.1%) |
| $750,000 to $999,999 | 1,895 (2.8%) | 2,944 (2.8%) |
| $1,000,000 or more | 1,072 (1.6%) | 1,115 (1.0%) |
| Total | 68,390 (100.0%) | 106,808 (100.0%) |
Household Income by Mortgage Status in Area Code 907
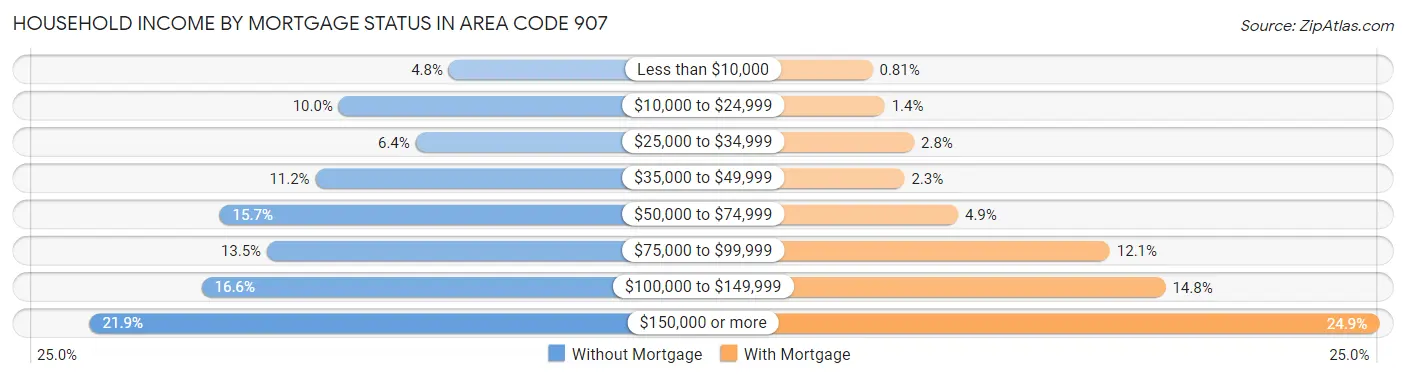
| Household Income | Without Mortgage | With Mortgage |
| Less than $10,000 | 3,282 (4.8%) | 868 (0.8%) |
| $10,000 to $24,999 | 6,869 (10.0%) | 1,488 (1.4%) |
| $25,000 to $34,999 | 4,360 (6.4%) | 2,977 (2.8%) |
| $35,000 to $49,999 | 7,624 (11.2%) | 2,492 (2.3%) |
| $50,000 to $74,999 | 10,741 (15.7%) | 5,212 (4.9%) |
| $75,000 to $99,999 | 9,202 (13.5%) | 12,933 (12.1%) |
| $100,000 to $149,999 | 11,335 (16.6%) | 15,766 (14.8%) |
| $150,000 or more | 14,977 (21.9%) | 26,631 (24.9%) |
| Total | 68,390 (100.0%) | 106,808 (100.0%) |
Property Value to Household Income Ratio in Area Code 907
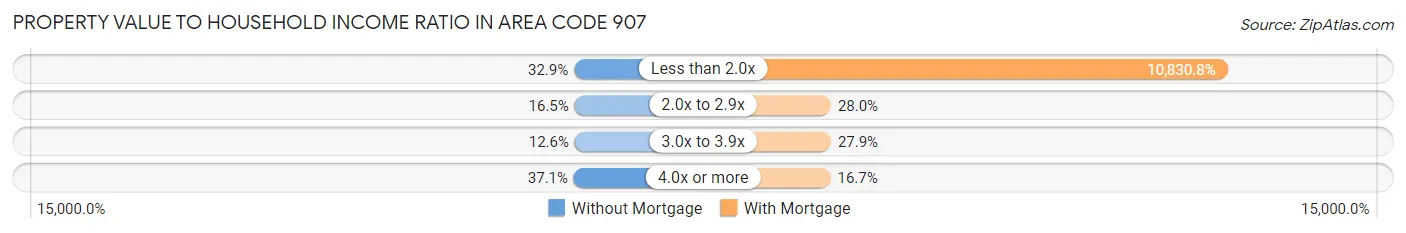
| Value-to-Income Ratio | Without Mortgage | With Mortgage |
| Less than 2.0x | 22,470 (32.9%) | 11,568,159 (10,830.8%) |
| 2.0x to 2.9x | 11,281 (16.5%) | 29,873 (28.0%) |
| 3.0x to 3.9x | 8,581 (12.6%) | 29,759 (27.9%) |
| 4.0x or more | 25,396 (37.1%) | 17,841 (16.7%) |
| Total | 68,390 (100.0%) | 106,808 (100.0%) |
Real Estate Taxes by Mortgage Status in Area Code 907
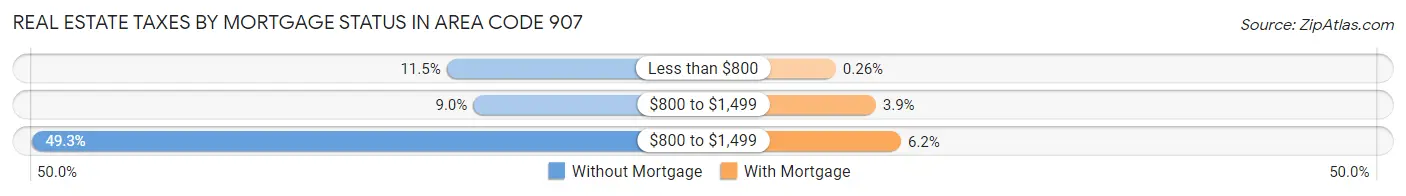
| Property Taxes | Without Mortgage | With Mortgage |
| Less than $800 | 7,841 (11.5%) | 283 (0.3%) |
| $800 to $1,499 | 6,181 (9.0%) | 4,181 (3.9%) |
| $800 to $1,499 | 33,700 (49.3%) | 6,630 (6.2%) |
| Total | 68,390 (100.0%) | 106,808 (100.0%) |
Health & Disability in Area Code 907
Health Insurance Coverage by Age in Area Code 907
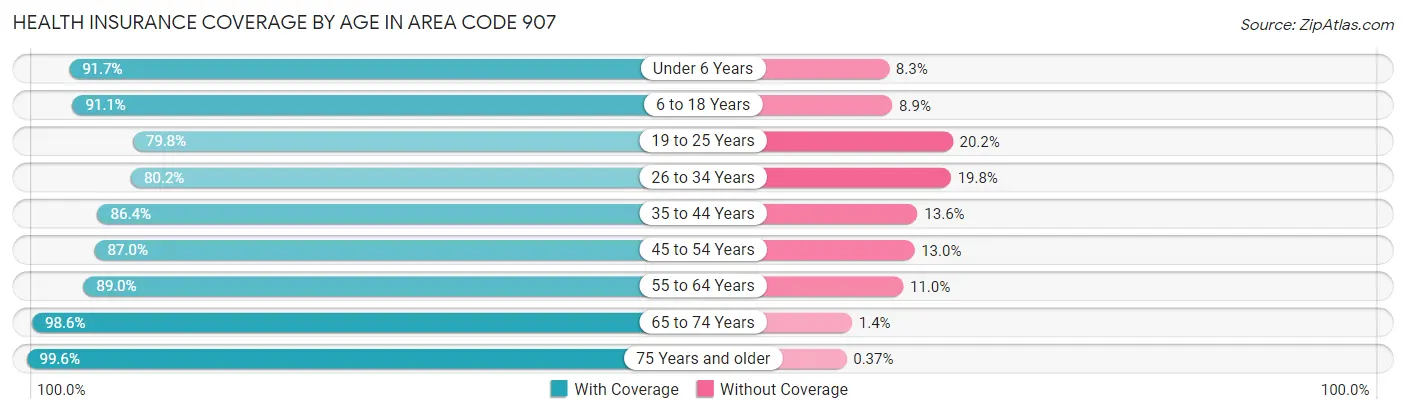
| Age Bracket | With Coverage | Without Coverage |
| Under 6 Years | 54,378 (91.7%) | 4,932 (8.3%) |
| 6 to 18 Years | 117,105 (91.1%) | 11,477 (8.9%) |
| 19 to 25 Years | 50,482 (79.8%) | 12,767 (20.2%) |
| 26 to 34 Years | 75,420 (80.2%) | 18,671 (19.8%) |
| 35 to 44 Years | 80,829 (86.4%) | 12,754 (13.6%) |
| 45 to 54 Years | 73,041 (87.0%) | 10,950 (13.0%) |
| 55 to 64 Years | 80,809 (89.0%) | 9,948 (11.0%) |
| 65 to 74 Years | 61,967 (98.6%) | 887 (1.4%) |
| 75 Years and older | 29,537 (99.6%) | 109 (0.4%) |
| Total | 623,568 (88.3%) | 82,495 (11.7%) |
Health Insurance Coverage by Citizenship Status in Area Code 907
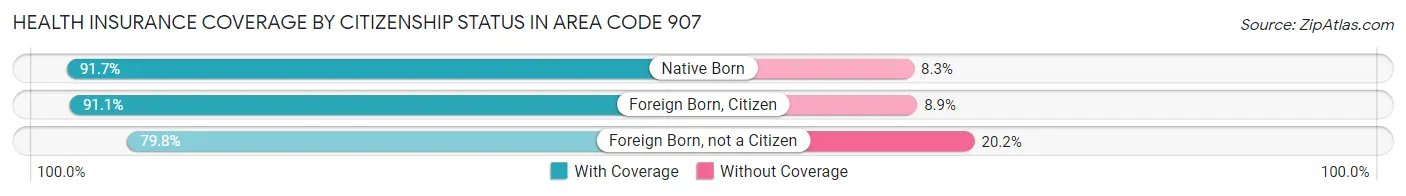
| Citizenship Status | With Coverage | Without Coverage |
| Native Born | 54,378 (91.7%) | 4,932 (8.3%) |
| Foreign Born, Citizen | 117,105 (91.1%) | 11,477 (8.9%) |
| Foreign Born, not a Citizen | 50,482 (79.8%) | 12,767 (20.2%) |
Health Insurance Coverage by Household Income in Area Code 907
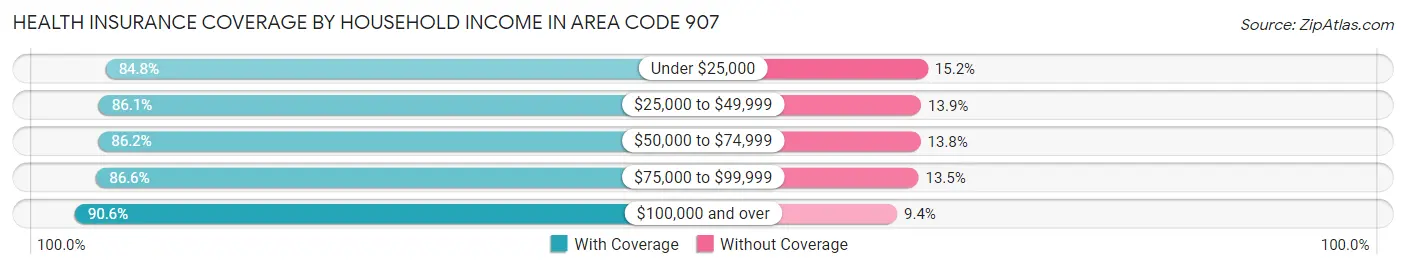
| Household Income | With Coverage | Without Coverage |
| Under $25,000 | 46,382 (84.8%) | 8,316 (15.2%) |
| $25,000 to $49,999 | 71,209 (86.1%) | 11,529 (13.9%) |
| $50,000 to $74,999 | 84,156 (86.2%) | 13,510 (13.8%) |
| $75,000 to $99,999 | 85,929 (86.6%) | 13,352 (13.5%) |
| $100,000 and over | 321,476 (90.6%) | 33,419 (9.4%) |
Public vs Private Health Insurance Coverage by Age in Area Code 907
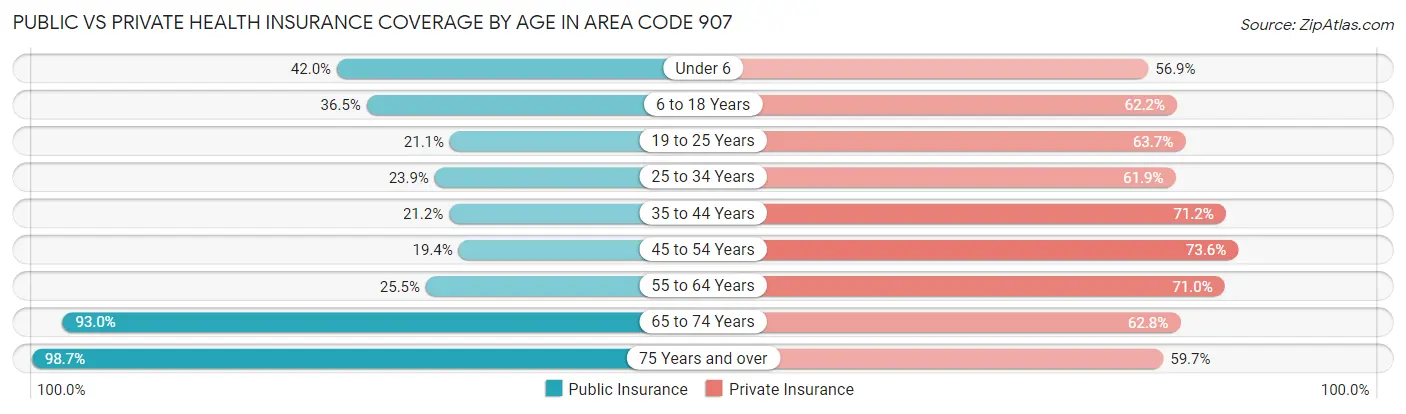
| Age Bracket | Public Insurance | Private Insurance |
| Under 6 | 24,927 (42.0%) | 33,746 (56.9%) |
| 6 to 18 Years | 46,945 (36.5%) | 79,961 (62.2%) |
| 19 to 25 Years | 13,325 (21.1%) | 40,281 (63.7%) |
| 25 to 34 Years | 22,472 (23.9%) | 58,237 (61.9%) |
| 35 to 44 Years | 19,872 (21.2%) | 66,656 (71.2%) |
| 45 to 54 Years | 16,326 (19.4%) | 61,780 (73.6%) |
| 55 to 64 Years | 23,158 (25.5%) | 64,467 (71.0%) |
| 65 to 74 Years | 58,436 (93.0%) | 39,461 (62.8%) |
| 75 Years and over | 29,248 (98.7%) | 17,690 (59.7%) |
| Total | 254,709 (36.1%) | 462,279 (65.5%) |
Disability Status by Sex by Age in Area Code 907
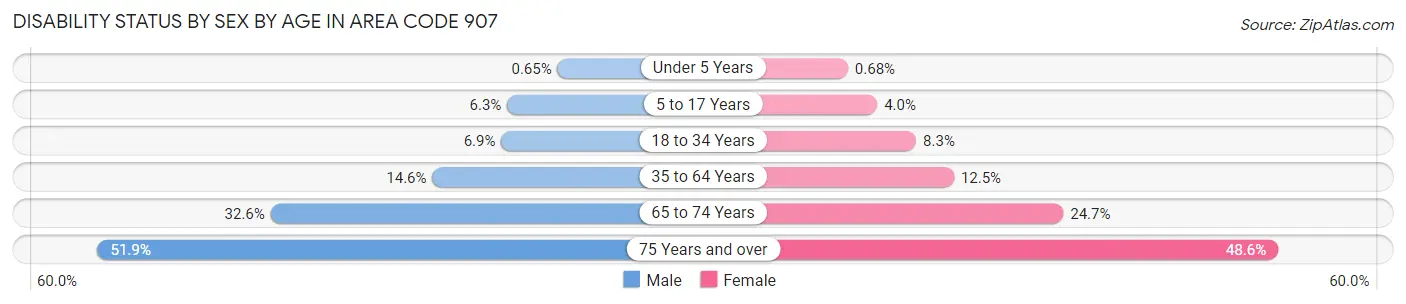
| Age Bracket | Male | Female |
| Under 5 Years | 163 (0.6%) | 162 (0.7%) |
| 5 to 17 Years | 4,183 (6.3%) | 2,494 (4.0%) |
| 18 to 34 Years | 5,906 (6.9%) | 6,686 (8.3%) |
| 35 to 64 Years | 20,277 (14.6%) | 16,157 (12.5%) |
| 65 to 74 Years | 10,627 (32.6%) | 7,466 (24.7%) |
| 75 Years and over | 7,013 (51.9%) | 7,834 (48.6%) |
Disability Class by Sex by Age in Area Code 907
Disability Class: Hearing Difficulty
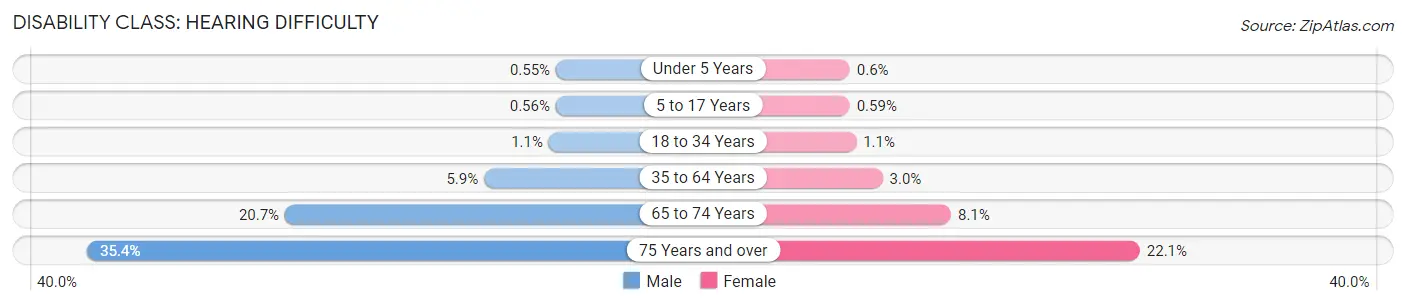
| Age Bracket | Male | Female |
| Under 5 Years | 139 (0.5%) | 142 (0.6%) |
| 5 to 17 Years | 371 (0.6%) | 374 (0.6%) |
| 18 to 34 Years | 927 (1.1%) | 868 (1.1%) |
| 35 to 64 Years | 8,187 (5.9%) | 3,922 (3.0%) |
| 65 to 74 Years | 6,739 (20.7%) | 2,454 (8.1%) |
| 75 Years and over | 4,780 (35.4%) | 3,569 (22.1%) |
Disability Class: Vision Difficulty
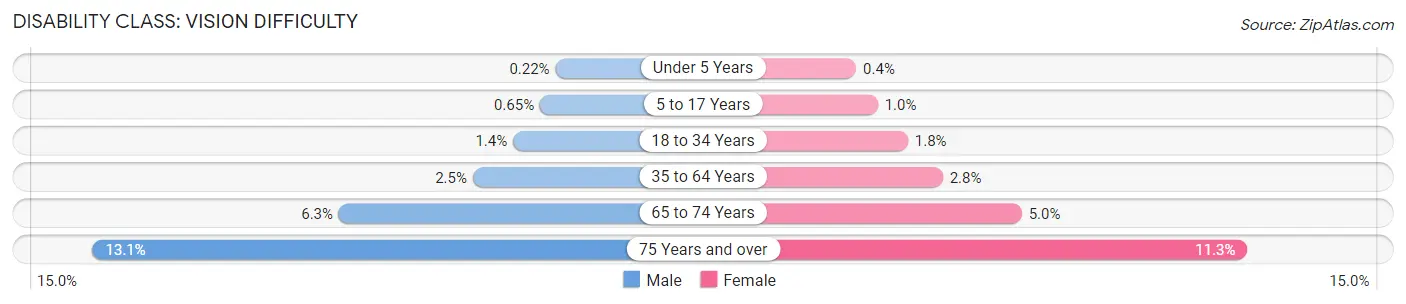
| Age Bracket | Male | Female |
| Under 5 Years | 56 (0.2%) | 96 (0.4%) |
| 5 to 17 Years | 437 (0.6%) | 634 (1.0%) |
| 18 to 34 Years | 1,200 (1.4%) | 1,487 (1.8%) |
| 35 to 64 Years | 3,499 (2.5%) | 3,639 (2.8%) |
| 65 to 74 Years | 2,036 (6.2%) | 1,517 (5.0%) |
| 75 Years and over | 1,773 (13.1%) | 1,820 (11.3%) |
Disability Class: Cognitive Difficulty
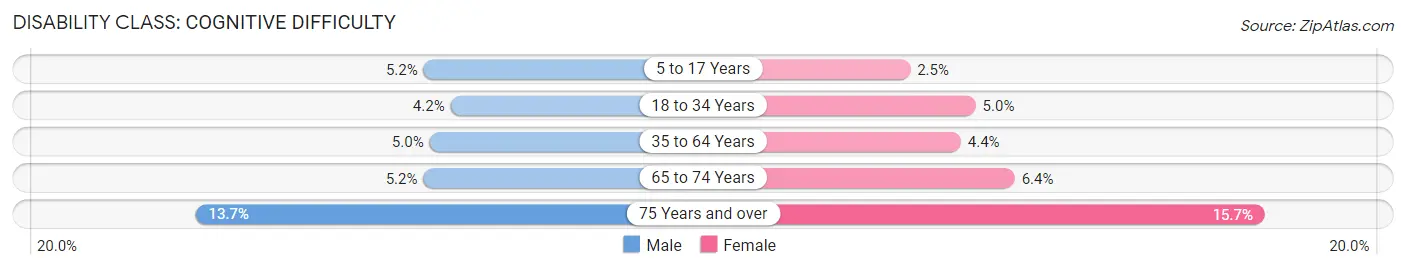
| Age Bracket | Male | Female |
| 5 to 17 Years | 3,463 (5.2%) | 1,606 (2.5%) |
| 18 to 34 Years | 3,579 (4.2%) | 4,012 (5.0%) |
| 35 to 64 Years | 6,902 (5.0%) | 5,716 (4.4%) |
| 65 to 74 Years | 1,694 (5.2%) | 1,944 (6.4%) |
| 75 Years and over | 1,845 (13.7%) | 2,532 (15.7%) |
Disability Class: Ambulatory Difficulty
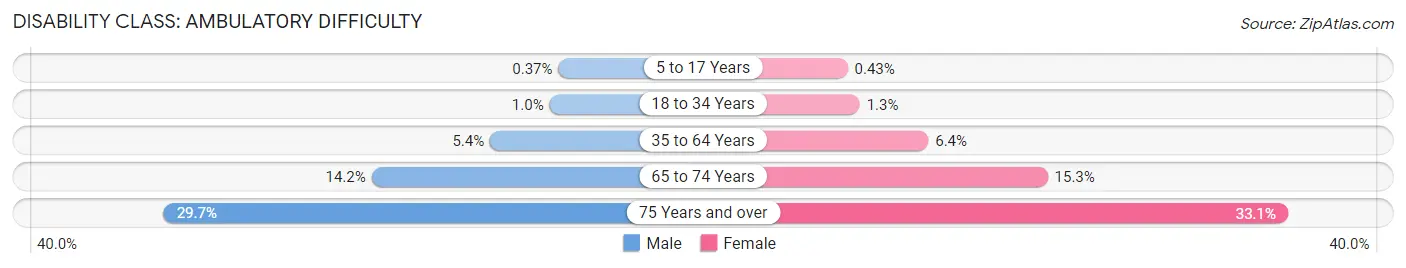
| Age Bracket | Male | Female |
| 5 to 17 Years | 250 (0.4%) | 274 (0.4%) |
| 18 to 34 Years | 881 (1.0%) | 1,078 (1.3%) |
| 35 to 64 Years | 7,566 (5.4%) | 8,304 (6.4%) |
| 65 to 74 Years | 4,643 (14.2%) | 4,625 (15.3%) |
| 75 Years and over | 4,011 (29.7%) | 5,340 (33.1%) |
Disability Class: Self-Care Difficulty
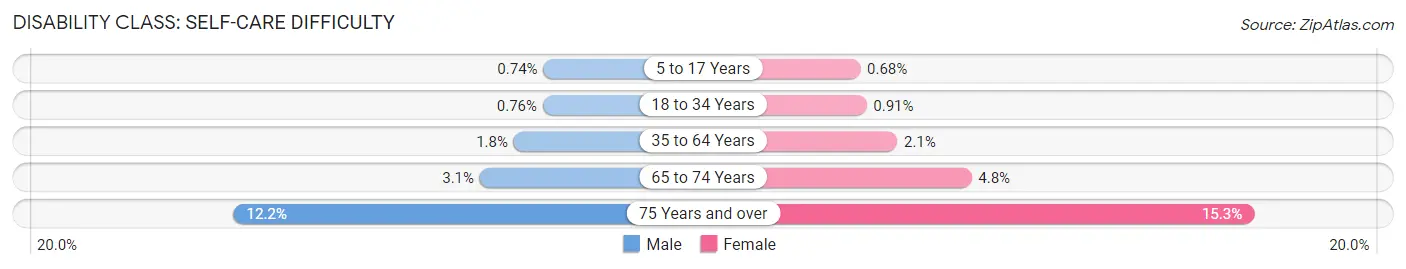
| Age Bracket | Male | Female |
| 5 to 17 Years | 496 (0.7%) | 430 (0.7%) |
| 18 to 34 Years | 647 (0.8%) | 736 (0.9%) |
| 35 to 64 Years | 2,553 (1.8%) | 2,649 (2.1%) |
| 65 to 74 Years | 1,012 (3.1%) | 1,454 (4.8%) |
| 75 Years and over | 1,655 (12.2%) | 2,468 (15.3%) |
Technology Access in Area Code 907
Computing Device Access in Area Code 907
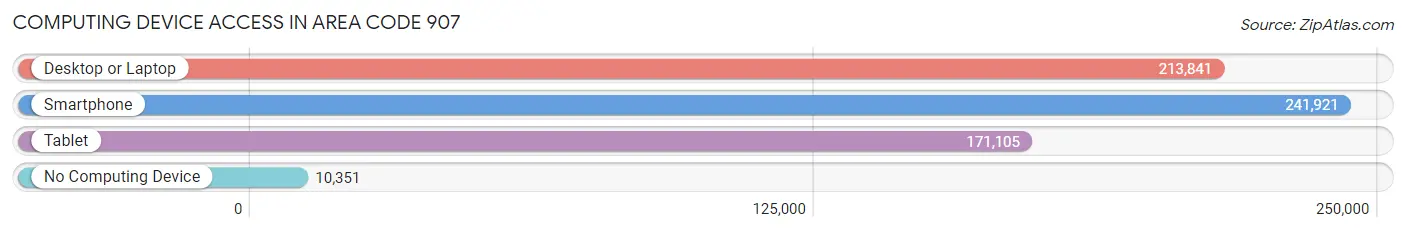
| Device Type | # Households | % Households |
| Desktop or Laptop | 213,841 | 80.9% |
| Smartphone | 241,921 | 91.5% |
| Tablet | 171,105 | 64.7% |
| No Computing Device | 10,351 | 3.9% |
| Total | 264,362 | 100.0% |
Internet Access in Area Code 907
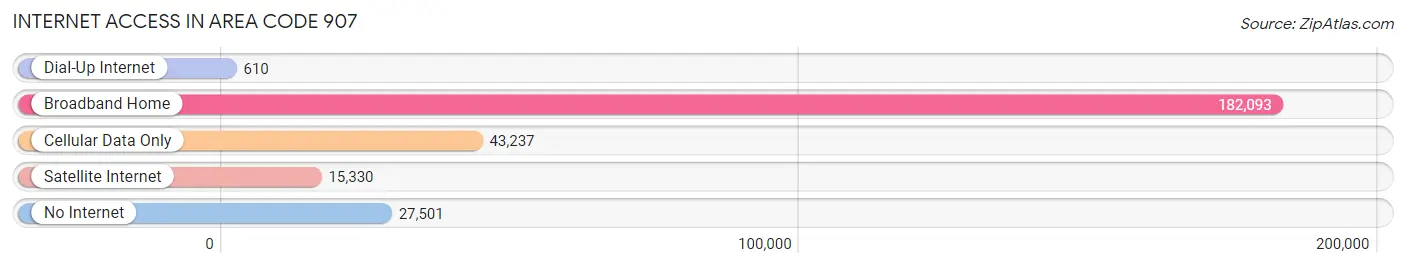
| Internet Type | # Households | % Households |
| Dial-Up Internet | 610 | 0.2% |
| Broadband Home | 182,093 | 68.9% |
| Cellular Data Only | 43,237 | 16.4% |
| Satellite Internet | 15,330 | 5.8% |
| No Internet | 27,501 | 10.4% |
| Total | 264,362 | 100.0% |
Area Code 907 Summary
Geography
Area code 907 is located in the state of Alaska. It is the only area code in the state and covers the entire state. It is bordered by Canada to the east, the Pacific Ocean to the south, and the Arctic Ocean to the north.
Social
Area code 907 is home to a diverse population of people from all walks of life. The state is known for its unique culture and traditions, and the area code reflects this. The area code is also home to a variety of languages, including English, Spanish, and Yup'ik.
Economics
Area code 907 is home to a variety of industries, including fishing, oil and gas, tourism, and mining. The state is also home to a number of large corporations, such as BP, ExxonMobil, and ConocoPhillips.
Demographics
Area code 907 is home to a population of over 730,000 people. The population is largely made up of Native Americans, with the largest group being the Alaska Native people. The population is also diverse in terms of age, with the median age being 33.5 years.
Common Questions
What is Per Capita Income in Area Code 907?
Per Capita income in Area Code 907 is $33,313.
What is the Median Family Income in Area Code 907?
Median Family Income in Area Code 907 is $77,010.
What is the Median Household income in Area Code 907?
Median Household Income in Area Code 907 is $64,271.
What is Income or Wage Gap in Area Code 907?
Income or Wage Gap in Area Code 907 is 29.9%.
Women in Area Code 907 earn 70.1 cents for every dollar earned by a man.
What is Family Income Deficit in Area Code 907?
Family Income Deficit in Area Code 907 is $11,444.
Families that are below poverty line in Area Code 907 earn $11,444 less on average than the poverty threshold level.
What is Inequality or Gini Index in Area Code 907?
Inequality or Gini Index in Area Code 907 is 92.81.
What is the Total Population of Area Code 907?
Total Population of Area Code 907 is 734,264.
What is the Total Male Population of Area Code 907?
Total Male Population of Area Code 907 is 386,162.
What is the Total Female Population of Area Code 907?
Total Female Population of Area Code 907 is 348,102.
What is the Ratio of Males per 100 Females in Area Code 907?
There are 110.93 Males per 100 Females in Area Code 907.
What is the Ratio of Females per 100 Males in Area Code 907?
There are 90.14 Females per 100 Males in Area Code 907.
What is the Median Population Age in Area Code 907?
Median Population Age in Area Code 907 is 36.5 Years.
What is the Average Family Size in Area Code 907
Average Family Size in Area Code 907 is 3.7 People.
What is the Average Household Size in Area Code 907
Average Household Size in Area Code 907 is 3.1 People.
How Large is the Labor Force in Area Code 907?
There are 362,016 People in the Labor Forcein in Area Code 907.
What is the Percentage of People in the Labor Force in Area Code 907?
63.1% of People are in the Labor Force in Area Code 907.
What is the Unemployment Rate in Area Code 907?
Unemployment Rate in Area Code 907 is 15.3%.