Zip Codes with the Highest Percentage of Households Heated by Bottled Gas / Liquid Propane in Arkansas
RELATED REPORTS & OPTIONS
Bottled Gas / LP Heating
Arkansas
Compare Zip Codes
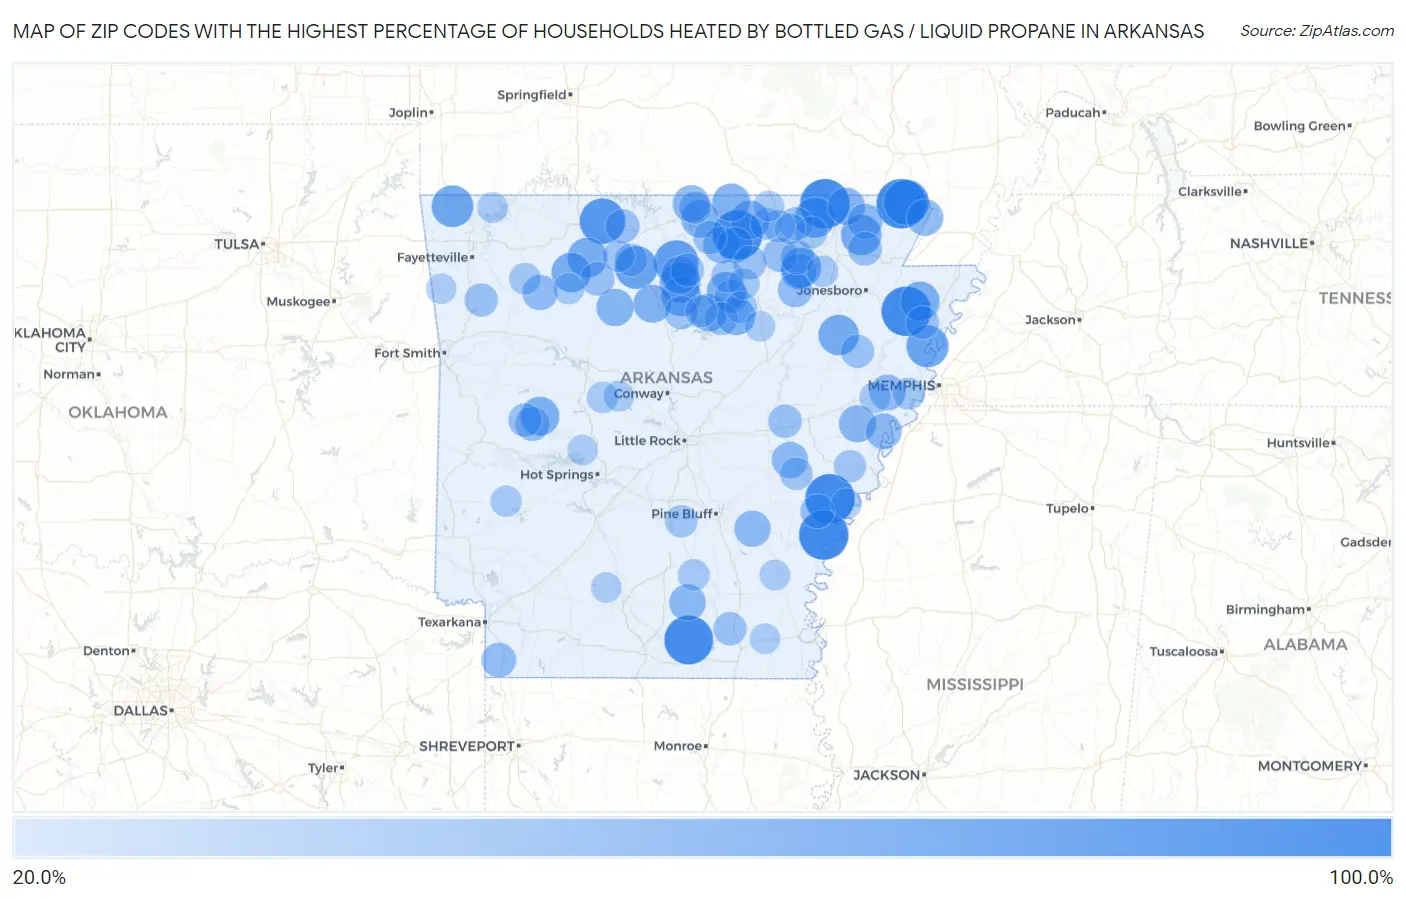
Map of Zip Codes with the Highest Percentage of Households Heated by Bottled Gas / Liquid Propane in Arkansas
20.0%
100.0%
Zip Codes with the Highest Percentage of Households Heated by Bottled Gas / Liquid Propane in Arkansas
| Zip Code | Bottled Gas / LP Heating | vs State | vs National | |
| 1. | 72478 | 100.0% | 6.5%(+93.5)#1 | 4.9%(+95.1)#11 |
| 2. | 72353 | 100.0% | 6.5%(+93.5)#2 | 4.9%(+95.1)#61 |
| 3. | 72377 | 100.0% | 6.5%(+93.5)#3 | 4.9%(+95.1)#86 |
| 4. | 72441 | 100.0% | 6.5%(+93.5)#4 | 4.9%(+95.1)#99 |
| 5. | 72379 | 100.0% | 6.5%(+93.5)#5 | 4.9%(+95.1)#117 |
| 6. | 72587 | 100.0% | 6.5%(+93.5)#6 | 4.9%(+95.1)#129 |
| 7. | 71651 | 97.3% | 6.5%(+90.8)#7 | 4.9%(+92.4)#139 |
| 8. | 72615 | 85.7% | 6.5%(+79.2)#8 | 4.9%(+80.8)#258 |
| 9. | 72456 | 84.3% | 6.5%(+77.8)#9 | 4.9%(+79.4)#282 |
| 10. | 72617 | 81.1% | 6.5%(+74.6)#10 | 4.9%(+76.2)#361 |
| 11. | 72636 | 75.0% | 6.5%(+68.5)#11 | 4.9%(+70.1)#554 |
| 12. | 72338 | 72.7% | 6.5%(+66.2)#12 | 4.9%(+67.8)#640 |
| 13. | 72739 | 71.1% | 6.5%(+64.6)#13 | 4.9%(+66.2)#688 |
| 14. | 72680 | 66.8% | 6.5%(+60.3)#14 | 4.9%(+61.9)#898 |
| 15. | 72425 | 66.7% | 6.5%(+60.2)#15 | 4.9%(+61.8)#912 |
| 16. | 72429 | 66.7% | 6.5%(+60.2)#16 | 4.9%(+61.8)#914 |
| 17. | 72460 | 66.3% | 6.5%(+59.8)#17 | 4.9%(+61.4)#944 |
| 18. | 72440 | 64.4% | 6.5%(+57.9)#18 | 4.9%(+59.5)#1,054 |
| 19. | 72648 | 64.1% | 6.5%(+57.6)#19 | 4.9%(+59.2)#1,075 |
| 20. | 72051 | 64.1% | 6.5%(+57.6)#20 | 4.9%(+59.2)#1,076 |
| 21. | 72666 | 63.6% | 6.5%(+57.1)#21 | 4.9%(+58.7)#1,118 |
| 22. | 72428 | 62.0% | 6.5%(+55.5)#22 | 4.9%(+57.1)#1,228 |
| 23. | 72567 | 60.9% | 6.5%(+54.4)#23 | 4.9%(+56.0)#1,307 |
| 24. | 72828 | 60.3% | 6.5%(+53.8)#24 | 4.9%(+55.4)#1,363 |
| 25. | 72539 | 59.5% | 6.5%(+53.0)#25 | 4.9%(+54.6)#1,417 |
| 26. | 72629 | 57.4% | 6.5%(+50.9)#26 | 4.9%(+52.5)#1,605 |
| 27. | 72523 | 57.3% | 6.5%(+50.8)#27 | 4.9%(+52.4)#1,612 |
| 28. | 72578 | 57.3% | 6.5%(+50.8)#28 | 4.9%(+52.4)#1,617 |
| 29. | 72531 | 57.1% | 6.5%(+50.6)#29 | 4.9%(+52.2)#1,625 |
| 30. | 72663 | 56.6% | 6.5%(+50.1)#30 | 4.9%(+51.7)#1,673 |
| 31. | 72444 | 54.7% | 6.5%(+48.2)#31 | 4.9%(+49.8)#1,835 |
| 32. | 72130 | 54.7% | 6.5%(+48.2)#32 | 4.9%(+49.8)#1,842 |
| 33. | 72686 | 54.5% | 6.5%(+48.0)#33 | 4.9%(+49.6)#1,862 |
| 34. | 72341 | 54.4% | 6.5%(+47.9)#34 | 4.9%(+49.5)#1,868 |
| 35. | 72537 | 54.3% | 6.5%(+47.8)#35 | 4.9%(+49.4)#1,877 |
| 36. | 72430 | 52.5% | 6.5%(+46.0)#36 | 4.9%(+47.6)#2,044 |
| 37. | 71631 | 52.4% | 6.5%(+45.9)#37 | 4.9%(+47.5)#2,056 |
| 38. | 72517 | 52.4% | 6.5%(+45.9)#38 | 4.9%(+47.5)#2,060 |
| 39. | 72134 | 51.4% | 6.5%(+44.9)#39 | 4.9%(+46.5)#2,144 |
| 40. | 71644 | 51.3% | 6.5%(+44.8)#40 | 4.9%(+46.4)#2,156 |
| 41. | 72320 | 50.0% | 6.5%(+43.5)#41 | 4.9%(+45.1)#2,264 |
| 42. | 72469 | 49.7% | 6.5%(+43.2)#42 | 4.9%(+44.8)#2,312 |
| 43. | 72346 | 49.7% | 6.5%(+43.2)#43 | 4.9%(+44.8)#2,318 |
| 44. | 72584 | 49.5% | 6.5%(+43.0)#44 | 4.9%(+44.6)#2,338 |
| 45. | 72752 | 47.7% | 6.5%(+41.2)#45 | 4.9%(+42.8)#2,537 |
| 46. | 72453 | 47.6% | 6.5%(+41.1)#46 | 4.9%(+42.7)#2,546 |
| 47. | 71834 | 45.6% | 6.5%(+39.1)#47 | 4.9%(+40.7)#2,773 |
| 48. | 72827 | 45.2% | 6.5%(+38.7)#48 | 4.9%(+40.3)#2,836 |
| 49. | 72524 | 45.0% | 6.5%(+38.5)#49 | 4.9%(+40.1)#2,850 |
| 50. | 72048 | 43.8% | 6.5%(+37.3)#50 | 4.9%(+38.9)#3,015 |
| 51. | 72569 | 43.4% | 6.5%(+36.9)#51 | 4.9%(+38.5)#3,058 |
| 52. | 72672 | 43.1% | 6.5%(+36.6)#52 | 4.9%(+38.2)#3,092 |
| 53. | 72655 | 42.8% | 6.5%(+36.3)#53 | 4.9%(+37.9)#3,139 |
| 54. | 72412 | 42.7% | 6.5%(+36.2)#54 | 4.9%(+37.8)#3,151 |
| 55. | 72466 | 42.1% | 6.5%(+35.6)#55 | 4.9%(+37.2)#3,246 |
| 56. | 72838 | 41.7% | 6.5%(+35.2)#56 | 4.9%(+36.8)#3,309 |
| 57. | 72577 | 41.6% | 6.5%(+35.1)#57 | 4.9%(+36.7)#3,325 |
| 58. | 72017 | 41.4% | 6.5%(+34.9)#58 | 4.9%(+36.5)#3,354 |
| 59. | 72555 | 41.4% | 6.5%(+34.9)#59 | 4.9%(+36.5)#3,355 |
| 60. | 72566 | 41.0% | 6.5%(+34.5)#60 | 4.9%(+36.1)#3,403 |
| 61. | 72459 | 40.7% | 6.5%(+34.2)#61 | 4.9%(+35.8)#3,454 |
| 62. | 71642 | 40.6% | 6.5%(+34.1)#62 | 4.9%(+35.7)#3,477 |
| 63. | 72959 | 40.5% | 6.5%(+34.0)#63 | 4.9%(+35.6)#3,491 |
| 64. | 72324 | 40.5% | 6.5%(+34.0)#64 | 4.9%(+35.6)#3,493 |
| 65. | 72153 | 40.2% | 6.5%(+33.7)#65 | 4.9%(+35.3)#3,548 |
| 66. | 72533 | 40.2% | 6.5%(+33.7)#66 | 4.9%(+35.3)#3,553 |
| 67. | 72530 | 40.0% | 6.5%(+33.5)#67 | 4.9%(+35.1)#3,568 |
| 68. | 72330 | 39.6% | 6.5%(+33.1)#68 | 4.9%(+34.7)#3,644 |
| 69. | 72540 | 38.2% | 6.5%(+31.7)#69 | 4.9%(+33.3)#3,852 |
| 70. | 72026 | 38.1% | 6.5%(+31.6)#70 | 4.9%(+33.2)#3,868 |
| 71. | 72542 | 37.7% | 6.5%(+31.2)#71 | 4.9%(+32.8)#3,922 |
| 72. | 72675 | 37.7% | 6.5%(+31.2)#72 | 4.9%(+32.8)#3,928 |
| 73. | 72544 | 37.7% | 6.5%(+31.2)#73 | 4.9%(+32.8)#3,934 |
| 74. | 72057 | 37.6% | 6.5%(+31.1)#74 | 4.9%(+32.7)#3,951 |
| 75. | 72374 | 37.4% | 6.5%(+30.9)#75 | 4.9%(+32.5)#4,003 |
| 76. | 72044 | 36.3% | 6.5%(+29.8)#76 | 4.9%(+31.4)#4,198 |
| 77. | 72529 | 36.2% | 6.5%(+29.7)#77 | 4.9%(+31.3)#4,206 |
| 78. | 72434 | 36.2% | 6.5%(+29.7)#78 | 4.9%(+31.3)#4,209 |
| 79. | 72550 | 35.9% | 6.5%(+29.4)#79 | 4.9%(+31.0)#4,282 |
| 80. | 72376 | 35.8% | 6.5%(+29.3)#80 | 4.9%(+30.9)#4,302 |
| 81. | 72669 | 35.8% | 6.5%(+29.3)#81 | 4.9%(+30.9)#4,316 |
| 82. | 72776 | 35.1% | 6.5%(+28.6)#82 | 4.9%(+30.2)#4,443 |
| 83. | 72526 | 34.5% | 6.5%(+28.0)#83 | 4.9%(+29.6)#4,565 |
| 84. | 71660 | 34.0% | 6.5%(+27.5)#84 | 4.9%(+29.1)#4,653 |
| 85. | 72410 | 33.9% | 6.5%(+27.4)#85 | 4.9%(+29.0)#4,690 |
| 86. | 71952 | 33.3% | 6.5%(+26.8)#86 | 4.9%(+28.4)#4,829 |
| 87. | 72394 | 33.1% | 6.5%(+26.6)#87 | 4.9%(+28.2)#4,878 |
| 88. | 72482 | 33.0% | 6.5%(+26.5)#88 | 4.9%(+28.1)#4,893 |
| 89. | 72025 | 33.0% | 6.5%(+26.5)#89 | 4.9%(+28.1)#4,899 |
| 90. | 72628 | 32.9% | 6.5%(+26.4)#90 | 4.9%(+28.0)#4,912 |
| 91. | 72554 | 31.8% | 6.5%(+25.3)#91 | 4.9%(+26.9)#5,177 |
| 92. | 72333 | 31.8% | 6.5%(+25.3)#92 | 4.9%(+26.9)#5,189 |
| 93. | 72001 | 31.7% | 6.5%(+25.2)#93 | 4.9%(+26.8)#5,216 |
| 94. | 71677 | 31.6% | 6.5%(+25.1)#94 | 4.9%(+26.7)#5,247 |
| 95. | 72732 | 31.2% | 6.5%(+24.7)#95 | 4.9%(+26.3)#5,325 |
| 96. | 71658 | 30.6% | 6.5%(+24.1)#96 | 4.9%(+25.7)#5,487 |
| 97. | 72568 | 30.4% | 6.5%(+23.9)#97 | 4.9%(+25.5)#5,540 |
| 98. | 72717 | 30.1% | 6.5%(+23.6)#98 | 4.9%(+25.2)#5,622 |
| 99. | 71949 | 30.1% | 6.5%(+23.6)#99 | 4.9%(+25.2)#5,626 |
| 100. | 71726 | 30.0% | 6.5%(+23.5)#100 | 4.9%(+25.1)#5,645 |
Common Questions
What are the Top 10 Zip Codes with the Highest Percentage of Households Heated by Bottled Gas / Liquid Propane in Arkansas?
Top 10 Zip Codes with the Highest Percentage of Households Heated by Bottled Gas / Liquid Propane in Arkansas are:
What zip code has the Highest Percentage of Households Heated by Bottled Gas / Liquid Propane in Arkansas?
72478 has the Highest Percentage of Households Heated by Bottled Gas / Liquid Propane in Arkansas with 100.0%.
What is the Percentage of Households Heated by Bottled Gas / Liquid Propane in the State of Arkansas?
Percentage of Households Heated by Bottled Gas / Liquid Propane in Arkansas is 6.5%.
What is the Percentage of Households Heated by Bottled Gas / Liquid Propane in the United States?
Percentage of Households Heated by Bottled Gas / Liquid Propane in the United States is 4.9%.