Zip Codes with the Highest Percentage of Households Residing in Condos/Apartments in Arkansas
RELATED REPORTS & OPTIONS
Condo/Apartment Residency
Arkansas
Compare Zip Codes
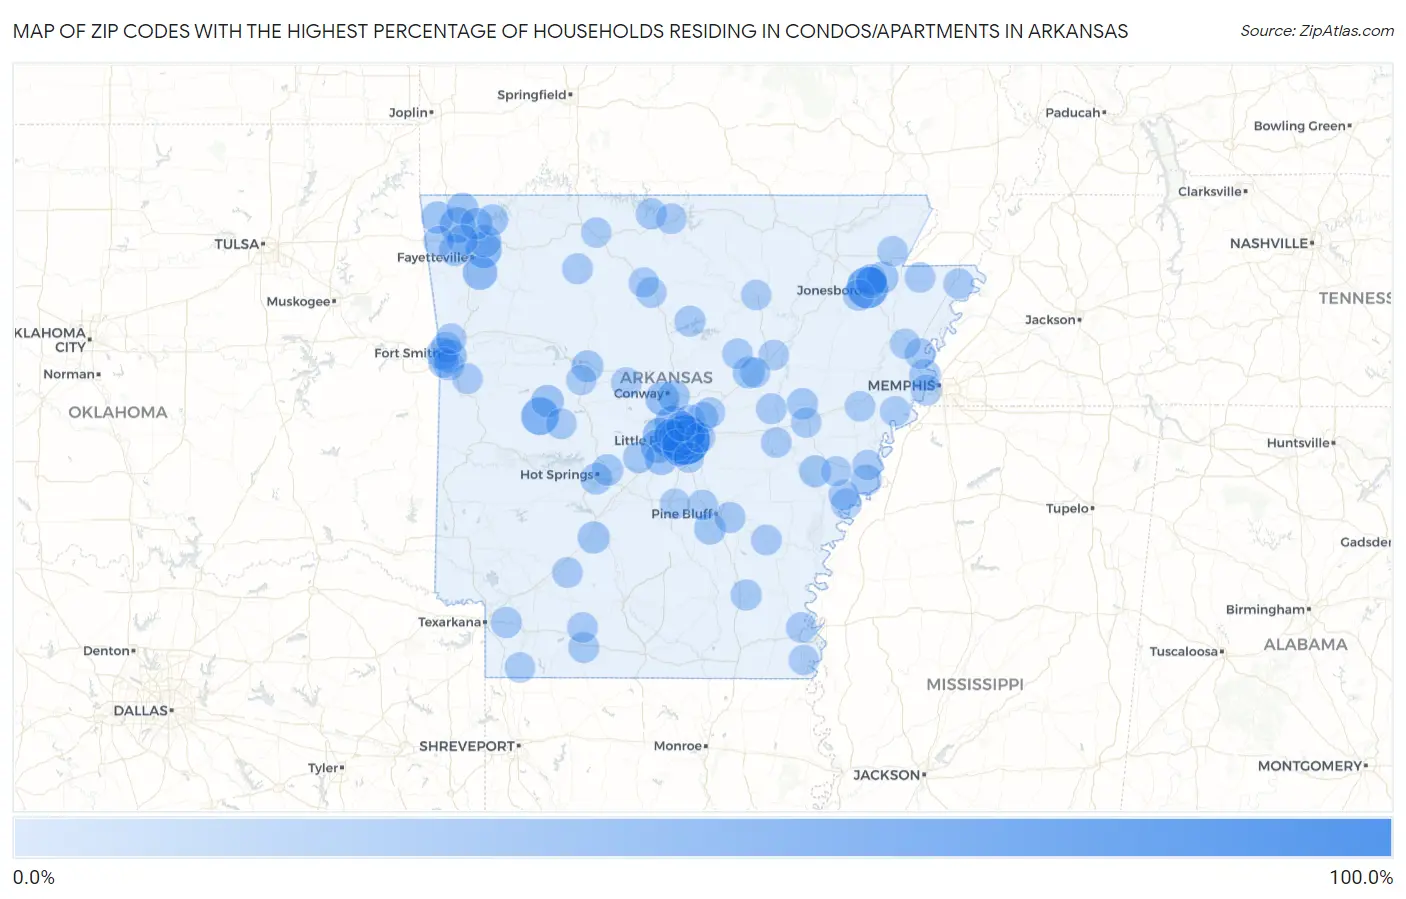
Map of Zip Codes with the Highest Percentage of Households Residing in Condos/Apartments in Arkansas
0.0%
100.0%
Zip Codes with the Highest Percentage of Households Residing in Condos/Apartments in Arkansas
| Zip Code | Detached Home Residency | vs State | vs National | |
| 1. | 72201 | 87.7% | 6.7%(+81.0)#1 | 13.8%(+73.9)#173 |
| 2. | 72467 | 51.9% | 6.7%(+45.2)#2 | 13.8%(+38.1)#553 |
| 3. | 72202 | 46.8% | 6.7%(+40.1)#3 | 13.8%(+33.0)#645 |
| 4. | 72828 | 34.9% | 6.7%(+28.2)#4 | 13.8%(+21.1)#1,014 |
| 5. | 72211 | 28.1% | 6.7%(+21.4)#5 | 13.8%(+14.3)#1,430 |
| 6. | 72703 | 27.4% | 6.7%(+20.7)#6 | 13.8%(+13.6)#1,489 |
| 7. | 72113 | 26.8% | 6.7%(+20.1)#7 | 13.8%(+13.0)#1,554 |
| 8. | 72114 | 26.2% | 6.7%(+19.5)#8 | 13.8%(+12.4)#1,615 |
| 9. | 72713 | 24.9% | 6.7%(+18.2)#9 | 13.8%(+11.1)#1,742 |
| 10. | 72701 | 21.7% | 6.7%(+15.0)#10 | 13.8%(+7.90)#2,135 |
| 11. | 72223 | 20.6% | 6.7%(+13.9)#11 | 13.8%(+6.80)#2,320 |
| 12. | 72034 | 18.9% | 6.7%(+12.2)#12 | 13.8%(+5.10)#2,639 |
| 13. | 72210 | 18.1% | 6.7%(+11.4)#13 | 13.8%(+4.30)#2,815 |
| 14. | 72205 | 17.1% | 6.7%(+10.4)#14 | 13.8%(+3.30)#3,015 |
| 15. | 72903 | 16.8% | 6.7%(+10.1)#15 | 13.8%(+3.00)#3,091 |
| 16. | 72207 | 13.8% | 6.7%(+7.10)#16 | 13.8%(=0.000)#3,971 |
| 17. | 72833 | 13.5% | 6.7%(+6.80)#17 | 13.8%(-0.300)#4,084 |
| 18. | 72764 | 13.1% | 6.7%(+6.40)#18 | 13.8%(-0.700)#4,186 |
| 19. | 72022 | 13.1% | 6.7%(+6.40)#19 | 13.8%(-0.700)#4,210 |
| 20. | 72227 | 12.7% | 6.7%(+6.00)#20 | 13.8%(-1.10)#4,339 |
| 21. | 72209 | 12.1% | 6.7%(+5.40)#21 | 13.8%(-1.70)#4,567 |
| 22. | 72722 | 11.2% | 6.7%(+4.50)#22 | 13.8%(-2.60)#4,960 |
| 23. | 72901 | 11.1% | 6.7%(+4.40)#23 | 13.8%(-2.70)#4,987 |
| 24. | 71923 | 11.0% | 6.7%(+4.30)#24 | 13.8%(-2.80)#5,039 |
| 25. | 72032 | 10.8% | 6.7%(+4.10)#25 | 13.8%(-3.00)#5,118 |
| 26. | 72143 | 10.8% | 6.7%(+4.10)#26 | 13.8%(-3.00)#5,119 |
| 27. | 72116 | 10.6% | 6.7%(+3.90)#27 | 13.8%(-3.20)#5,218 |
| 28. | 72704 | 10.4% | 6.7%(+3.70)#28 | 13.8%(-3.40)#5,296 |
| 29. | 72212 | 10.3% | 6.7%(+3.60)#29 | 13.8%(-3.50)#5,357 |
| 30. | 72069 | 10.1% | 6.7%(+3.40)#30 | 13.8%(-3.70)#5,475 |
| 31. | 72712 | 10.0% | 6.7%(+3.30)#31 | 13.8%(-3.80)#5,491 |
| 32. | 72801 | 9.8% | 6.7%(+3.10)#32 | 13.8%(-4.00)#5,595 |
| 33. | 72417 | 9.8% | 6.7%(+3.10)#33 | 13.8%(-4.00)#5,609 |
| 34. | 72758 | 9.7% | 6.7%(+3.00)#34 | 13.8%(-4.10)#5,629 |
| 35. | 71603 | 9.3% | 6.7%(+2.60)#35 | 13.8%(-4.50)#5,846 |
| 36. | 72405 | 8.9% | 6.7%(+2.20)#36 | 13.8%(-4.90)#6,078 |
| 37. | 71913 | 8.5% | 6.7%(+1.80)#37 | 13.8%(-5.30)#6,306 |
| 38. | 72204 | 8.5% | 6.7%(+1.80)#38 | 13.8%(-5.30)#6,323 |
| 39. | 71901 | 8.3% | 6.7%(+1.60)#39 | 13.8%(-5.50)#6,460 |
| 40. | 72019 | 8.3% | 6.7%(+1.60)#40 | 13.8%(-5.50)#6,463 |
| 41. | 72364 | 8.3% | 6.7%(+1.60)#41 | 13.8%(-5.50)#6,481 |
| 42. | 72404 | 8.0% | 6.7%(+1.30)#42 | 13.8%(-5.80)#6,664 |
| 43. | 72401 | 7.8% | 6.7%(+1.10)#43 | 13.8%(-6.00)#6,795 |
| 44. | 72756 | 7.5% | 6.7%(+0.800)#44 | 13.8%(-6.30)#7,006 |
| 45. | 72036 | 7.3% | 6.7%(+0.600)#45 | 13.8%(-6.50)#7,195 |
| 46. | 72762 | 7.0% | 6.7%(+0.300)#46 | 13.8%(-6.80)#7,354 |
| 47. | 72076 | 6.7% | 6.7%(=0.000)#47 | 13.8%(-7.10)#7,592 |
| 48. | 72301 | 6.7% | 6.7%(=0.000)#48 | 13.8%(-7.10)#7,610 |
| 49. | 72619 | 6.6% | 6.7%(-0.100)#49 | 13.8%(-7.20)#7,748 |
| 50. | 71655 | 6.5% | 6.7%(-0.200)#50 | 13.8%(-7.30)#7,803 |
| 51. | 71854 | 6.4% | 6.7%(-0.300)#51 | 13.8%(-7.40)#7,861 |
| 52. | 72342 | 6.3% | 6.7%(-0.400)#52 | 13.8%(-7.50)#7,997 |
| 53. | 71753 | 6.2% | 6.7%(-0.500)#53 | 13.8%(-7.60)#8,057 |
| 54. | 72904 | 6.0% | 6.7%(-0.700)#54 | 13.8%(-7.80)#8,218 |
| 55. | 72088 | 6.0% | 6.7%(-0.700)#55 | 13.8%(-7.80)#8,269 |
| 56. | 71601 | 5.8% | 6.7%(-0.900)#56 | 13.8%(-8.00)#8,406 |
| 57. | 72916 | 5.8% | 6.7%(-0.900)#57 | 13.8%(-8.00)#8,412 |
| 58. | 72641 | 5.7% | 6.7%(-1.00)#58 | 13.8%(-8.10)#8,534 |
| 59. | 72761 | 5.6% | 6.7%(-1.10)#59 | 13.8%(-8.20)#8,575 |
| 60. | 72908 | 5.6% | 6.7%(-1.10)#60 | 13.8%(-8.20)#8,595 |
| 61. | 72040 | 5.4% | 6.7%(-1.30)#61 | 13.8%(-8.40)#8,805 |
| 62. | 72384 | 5.3% | 6.7%(-1.40)#62 | 13.8%(-8.50)#8,898 |
| 63. | 72315 | 5.2% | 6.7%(-1.50)#63 | 13.8%(-8.60)#8,934 |
| 64. | 72857 | 5.0% | 6.7%(-1.70)#64 | 13.8%(-8.80)#9,168 |
| 65. | 71643 | 4.9% | 6.7%(-1.80)#65 | 13.8%(-8.90)#9,241 |
| 66. | 72645 | 4.9% | 6.7%(-1.80)#66 | 13.8%(-8.90)#9,261 |
| 67. | 72956 | 4.7% | 6.7%(-2.00)#67 | 13.8%(-9.10)#9,403 |
| 68. | 71857 | 4.7% | 6.7%(-2.00)#68 | 13.8%(-9.10)#9,460 |
| 69. | 72085 | 4.7% | 6.7%(-2.00)#69 | 13.8%(-9.10)#9,499 |
| 70. | 72438 | 4.6% | 6.7%(-2.10)#70 | 13.8%(-9.20)#9,572 |
| 71. | 72333 | 4.6% | 6.7%(-2.10)#71 | 13.8%(-9.20)#9,586 |
| 72. | 71602 | 4.5% | 6.7%(-2.20)#72 | 13.8%(-9.30)#9,631 |
| 73. | 72653 | 4.4% | 6.7%(-2.30)#73 | 13.8%(-9.40)#9,732 |
| 74. | 72936 | 4.4% | 6.7%(-2.30)#74 | 13.8%(-9.40)#9,766 |
| 75. | 72389 | 4.4% | 6.7%(-2.30)#75 | 13.8%(-9.40)#9,813 |
| 76. | 72450 | 4.3% | 6.7%(-2.40)#76 | 13.8%(-9.50)#9,823 |
| 77. | 72120 | 4.3% | 6.7%(-2.40)#77 | 13.8%(-9.50)#9,829 |
| 78. | 72206 | 4.2% | 6.7%(-2.50)#78 | 13.8%(-9.60)#9,947 |
| 79. | 72117 | 4.2% | 6.7%(-2.50)#79 | 13.8%(-9.60)#9,966 |
| 80. | 71653 | 4.2% | 6.7%(-2.50)#80 | 13.8%(-9.60)#10,007 |
| 81. | 72041 | 4.2% | 6.7%(-2.50)#81 | 13.8%(-9.60)#10,027 |
| 82. | 71752 | 4.1% | 6.7%(-2.60)#82 | 13.8%(-9.70)#10,147 |
| 83. | 72335 | 4.0% | 6.7%(-2.70)#83 | 13.8%(-9.80)#10,187 |
| 84. | 72386 | 4.0% | 6.7%(-2.70)#84 | 13.8%(-9.80)#10,261 |
| 85. | 72139 | 4.0% | 6.7%(-2.70)#85 | 13.8%(-9.80)#10,279 |
| 86. | 72023 | 3.9% | 6.7%(-2.80)#86 | 13.8%(-9.90)#10,294 |
| 87. | 72348 | 3.9% | 6.7%(-2.80)#87 | 13.8%(-9.90)#10,399 |
| 88. | 72501 | 3.7% | 6.7%(-3.00)#88 | 13.8%(-10.1)#10,578 |
| 89. | 72021 | 3.7% | 6.7%(-3.00)#89 | 13.8%(-10.1)#10,651 |
| 90. | 71826 | 3.7% | 6.7%(-3.00)#90 | 13.8%(-10.1)#10,677 |
| 91. | 72150 | 3.6% | 6.7%(-3.10)#91 | 13.8%(-10.2)#10,734 |
| 92. | 72110 | 3.6% | 6.7%(-3.10)#92 | 13.8%(-10.2)#10,741 |
| 93. | 72650 | 3.6% | 6.7%(-3.10)#93 | 13.8%(-10.2)#10,778 |
| 94. | 72082 | 3.6% | 6.7%(-3.10)#94 | 13.8%(-10.2)#10,796 |
| 95. | 72390 | 3.5% | 6.7%(-3.20)#95 | 13.8%(-10.3)#10,898 |
| 96. | 71640 | 3.4% | 6.7%(-3.30)#96 | 13.8%(-10.4)#11,063 |
| 97. | 72601 | 3.3% | 6.7%(-3.40)#97 | 13.8%(-10.5)#11,123 |
| 98. | 72118 | 3.3% | 6.7%(-3.40)#98 | 13.8%(-10.5)#11,134 |
| 99. | 72834 | 3.3% | 6.7%(-3.40)#99 | 13.8%(-10.5)#11,172 |
| 100. | 72366 | 3.2% | 6.7%(-3.50)#100 | 13.8%(-10.6)#11,361 |
Common Questions
What are the Top 10 Zip Codes with the Highest Percentage of Households Residing in Condos/Apartments in Arkansas?
Top 10 Zip Codes with the Highest Percentage of Households Residing in Condos/Apartments in Arkansas are:
What zip code has the Highest Percentage of Households Residing in Condos/Apartments in Arkansas?
72201 has the Highest Percentage of Households Residing in Condos/Apartments in Arkansas with 87.7%.
What is the Percentage of Households Residing in Condos/Apartments in the State of Arkansas?
Percentage of Households Residing in Condos/Apartments in Arkansas is 6.7%.
What is the Percentage of Households Residing in Condos/Apartments in the United States?
Percentage of Households Residing in Condos/Apartments in the United States is 13.8%.