Zip Codes with the Highest Percentage of Population with a Degree in Social Sciences in Arkansas
RELATED REPORTS & OPTIONS
Social Sciences
Arkansas
Compare Zip Codes
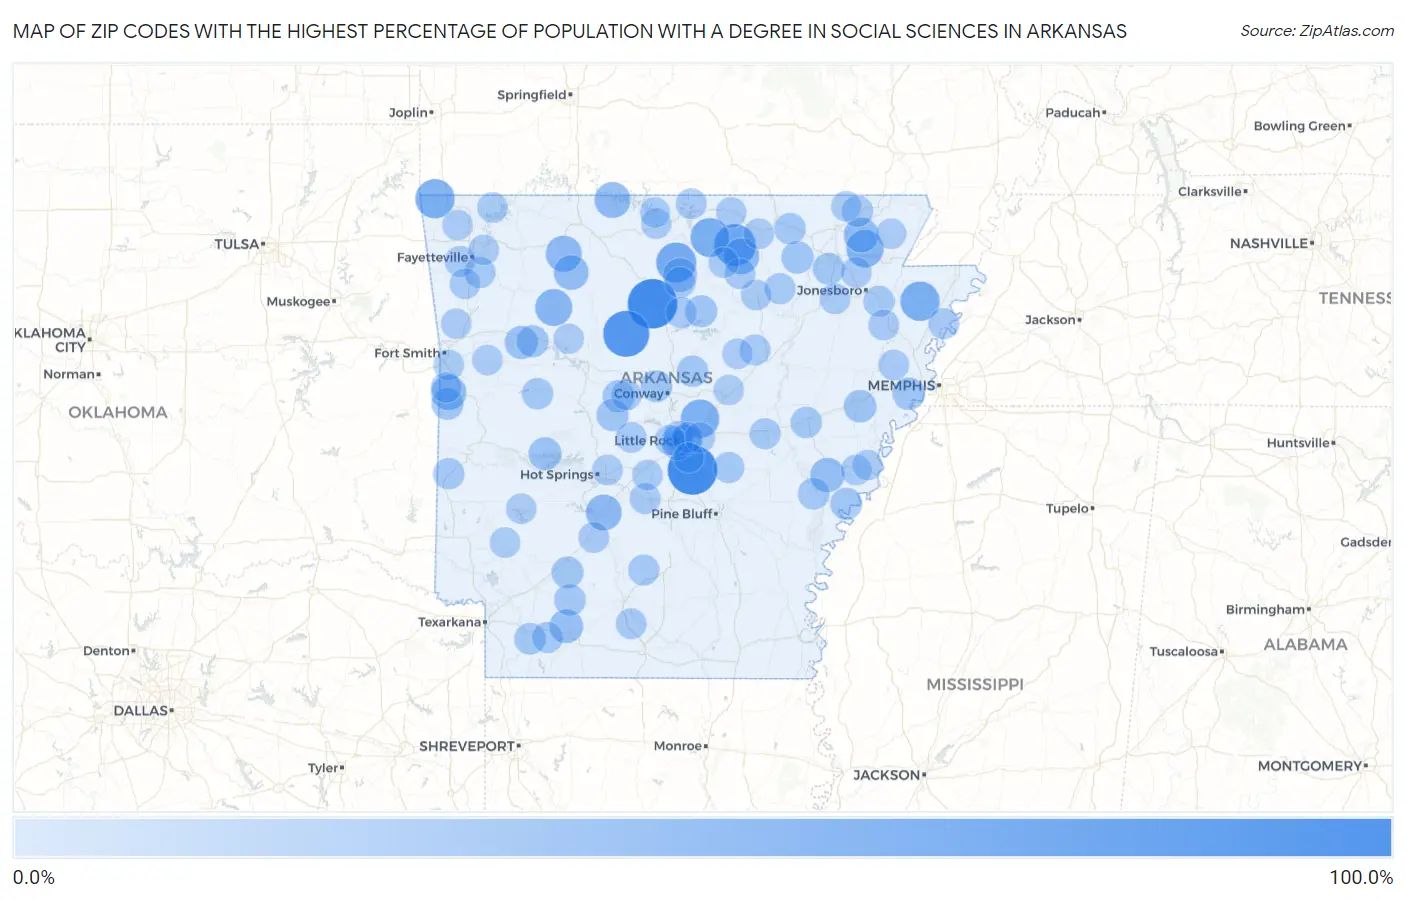
Map of Zip Codes with the Highest Percentage of Population with a Degree in Social Sciences in Arkansas
0.0%
100.0%
Zip Codes with the Highest Percentage of Population with a Degree in Social Sciences in Arkansas
| Zip Code | % Graduates | vs State | vs National | |
| 1. | 72629 | 100.0% | 5.3%(+94.7)#1 | 8.1%(+91.9)#12 |
| 2. | 72180 | 100.0% | 5.3%(+94.7)#2 | 8.1%(+91.9)#37 |
| 3. | 72080 | 82.9% | 5.3%(+77.6)#3 | 8.1%(+74.8)#61 |
| 4. | 72584 | 61.7% | 5.3%(+56.4)#4 | 8.1%(+53.6)#91 |
| 5. | 72617 | 53.6% | 5.3%(+48.3)#5 | 8.1%(+45.5)#126 |
| 6. | 72428 | 50.0% | 5.3%(+44.7)#6 | 8.1%(+41.9)#151 |
| 7. | 72768 | 49.4% | 5.3%(+44.1)#7 | 8.1%(+41.3)#167 |
| 8. | 72566 | 47.7% | 5.3%(+42.4)#8 | 8.1%(+39.7)#180 |
| 9. | 72099 | 45.5% | 5.3%(+40.2)#9 | 8.1%(+37.4)#193 |
| 10. | 72412 | 40.5% | 5.3%(+35.2)#10 | 8.1%(+32.4)#236 |
| 11. | 72854 | 38.4% | 5.3%(+33.1)#11 | 8.1%(+30.3)#262 |
| 12. | 72624 | 34.0% | 5.3%(+28.8)#12 | 8.1%(+26.0)#331 |
| 13. | 72573 | 33.3% | 5.3%(+28.0)#13 | 8.1%(+25.3)#341 |
| 14. | 71942 | 33.3% | 5.3%(+28.0)#14 | 8.1%(+25.3)#354 |
| 15. | 72630 | 33.3% | 5.3%(+28.0)#15 | 8.1%(+25.3)#359 |
| 16. | 72945 | 30.0% | 5.3%(+24.7)#16 | 8.1%(+21.9)#429 |
| 17. | 72425 | 28.9% | 5.3%(+23.6)#17 | 8.1%(+20.8)#463 |
| 18. | 72666 | 28.4% | 5.3%(+23.1)#18 | 8.1%(+20.3)#479 |
| 19. | 72383 | 26.3% | 5.3%(+21.0)#19 | 8.1%(+18.2)#577 |
| 20. | 72663 | 23.3% | 5.3%(+18.0)#20 | 8.1%(+15.2)#731 |
| 21. | 71770 | 23.2% | 5.3%(+17.9)#21 | 8.1%(+15.1)#735 |
| 22. | 72821 | 20.2% | 5.3%(+14.9)#22 | 8.1%(+12.1)#942 |
| 23. | 71970 | 19.4% | 5.3%(+14.2)#23 | 8.1%(+11.4)#1,028 |
| 24. | 72335 | 17.9% | 5.3%(+12.6)#24 | 8.1%(+9.83)#1,266 |
| 25. | 72376 | 17.2% | 5.3%(+11.9)#25 | 8.1%(+9.09)#1,364 |
| 26. | 72466 | 16.7% | 5.3%(+11.5)#26 | 8.1%(+8.68)#1,450 |
| 27. | 72001 | 15.6% | 5.3%(+10.3)#27 | 8.1%(+7.48)#1,775 |
| 28. | 72126 | 15.5% | 5.3%(+10.2)#28 | 8.1%(+7.41)#1,806 |
| 29. | 72840 | 15.5% | 5.3%(+10.2)#29 | 8.1%(+7.38)#1,816 |
| 30. | 72044 | 15.1% | 5.3%(+9.77)#30 | 8.1%(+6.98)#1,928 |
| 31. | 71857 | 14.9% | 5.3%(+9.65)#31 | 8.1%(+6.87)#1,979 |
| 32. | 72333 | 14.8% | 5.3%(+9.53)#32 | 8.1%(+6.74)#2,019 |
| 33. | 72938 | 14.7% | 5.3%(+9.44)#33 | 8.1%(+6.66)#2,048 |
| 34. | 72107 | 14.3% | 5.3%(+9.00)#34 | 8.1%(+6.21)#2,239 |
| 35. | 72445 | 14.3% | 5.3%(+9.00)#35 | 8.1%(+6.21)#2,242 |
| 36. | 71858 | 13.5% | 5.3%(+8.25)#36 | 8.1%(+5.47)#2,570 |
| 37. | 72140 | 13.3% | 5.3%(+8.04)#37 | 8.1%(+5.26)#2,665 |
| 38. | 71845 | 13.0% | 5.3%(+7.70)#38 | 8.1%(+4.92)#2,834 |
| 39. | 72482 | 12.5% | 5.3%(+7.21)#39 | 8.1%(+4.43)#3,122 |
| 40. | 72021 | 12.3% | 5.3%(+6.99)#40 | 8.1%(+4.21)#3,301 |
| 41. | 72047 | 12.1% | 5.3%(+6.83)#41 | 8.1%(+4.05)#3,408 |
| 42. | 72842 | 12.0% | 5.3%(+6.75)#42 | 8.1%(+3.97)#3,478 |
| 43. | 71945 | 11.5% | 5.3%(+6.25)#43 | 8.1%(+3.47)#3,890 |
| 44. | 72462 | 11.4% | 5.3%(+6.14)#44 | 8.1%(+3.36)#3,975 |
| 45. | 72046 | 11.1% | 5.3%(+5.79)#45 | 8.1%(+3.00)#4,311 |
| 46. | 71860 | 11.1% | 5.3%(+5.78)#46 | 8.1%(+3.00)#4,313 |
| 47. | 72579 | 11.0% | 5.3%(+5.71)#47 | 8.1%(+2.93)#4,378 |
| 48. | 72411 | 10.5% | 5.3%(+5.19)#48 | 8.1%(+2.41)#4,961 |
| 49. | 71720 | 10.5% | 5.3%(+5.18)#49 | 8.1%(+2.39)#4,980 |
| 50. | 72680 | 10.4% | 5.3%(+5.16)#50 | 8.1%(+2.38)#4,996 |
| 51. | 72701 | 10.2% | 5.3%(+4.95)#51 | 8.1%(+2.17)#5,262 |
| 52. | 72064 | 10.1% | 5.3%(+4.79)#52 | 8.1%(+2.01)#5,463 |
| 53. | 72081 | 9.9% | 5.3%(+4.62)#53 | 8.1%(+1.83)#5,676 |
| 54. | 72153 | 9.9% | 5.3%(+4.57)#54 | 8.1%(+1.78)#5,744 |
| 55. | 72202 | 9.7% | 5.3%(+4.45)#55 | 8.1%(+1.66)#5,890 |
| 56. | 72395 | 9.7% | 5.3%(+4.39)#56 | 8.1%(+1.61)#5,971 |
| 57. | 72416 | 9.7% | 5.3%(+4.37)#57 | 8.1%(+1.59)#6,001 |
| 58. | 72128 | 9.6% | 5.3%(+4.29)#58 | 8.1%(+1.50)#6,117 |
| 59. | 71751 | 9.3% | 5.3%(+4.01)#59 | 8.1%(+1.23)#6,489 |
| 60. | 72205 | 9.3% | 5.3%(+4.01)#60 | 8.1%(+1.22)#6,504 |
| 61. | 72730 | 9.3% | 5.3%(+3.98)#61 | 8.1%(+1.20)#6,527 |
| 62. | 72472 | 9.3% | 5.3%(+3.96)#62 | 8.1%(+1.18)#6,541 |
| 63. | 71923 | 9.0% | 5.3%(+3.68)#63 | 8.1%(+0.895)#7,008 |
| 64. | 72207 | 9.0% | 5.3%(+3.67)#64 | 8.1%(+0.890)#7,012 |
| 65. | 72513 | 8.9% | 5.3%(+3.63)#65 | 8.1%(+0.851)#7,083 |
| 66. | 72774 | 8.9% | 5.3%(+3.57)#66 | 8.1%(+0.783)#7,187 |
| 67. | 72537 | 8.8% | 5.3%(+3.54)#67 | 8.1%(+0.752)#7,223 |
| 68. | 72501 | 8.7% | 5.3%(+3.46)#68 | 8.1%(+0.675)#7,352 |
| 69. | 71901 | 8.7% | 5.3%(+3.42)#69 | 8.1%(+0.642)#7,406 |
| 70. | 72561 | 8.7% | 5.3%(+3.38)#70 | 8.1%(+0.596)#7,491 |
| 71. | 72355 | 8.6% | 5.3%(+3.35)#71 | 8.1%(+0.571)#7,534 |
| 72. | 72421 | 8.6% | 5.3%(+3.28)#72 | 8.1%(+0.500)#7,672 |
| 73. | 72204 | 8.5% | 5.3%(+3.25)#73 | 8.1%(+0.466)#7,735 |
| 74. | 72331 | 8.5% | 5.3%(+3.22)#74 | 8.1%(+0.439)#7,777 |
| 75. | 72114 | 8.5% | 5.3%(+3.19)#75 | 8.1%(+0.403)#7,855 |
| 76. | 72576 | 8.4% | 5.3%(+3.13)#76 | 8.1%(+0.350)#7,960 |
| 77. | 72916 | 8.4% | 5.3%(+3.11)#77 | 8.1%(+0.324)#7,999 |
| 78. | 72122 | 8.4% | 5.3%(+3.10)#78 | 8.1%(+0.314)#8,022 |
| 79. | 72015 | 8.3% | 5.3%(+3.03)#79 | 8.1%(+0.243)#8,159 |
| 80. | 72713 | 8.1% | 5.3%(+2.82)#80 | 8.1%(+0.042)#8,524 |
| 81. | 72117 | 8.1% | 5.3%(+2.79)#81 | 8.1%(+0.008)#8,588 |
| 82. | 72952 | 8.0% | 5.3%(+2.75)#82 | 8.1%(-0.037)#8,675 |
| 83. | 72085 | 8.0% | 5.3%(+2.71)#83 | 8.1%(-0.071)#8,758 |
| 84. | 72933 | 7.9% | 5.3%(+2.65)#84 | 8.1%(-0.129)#8,864 |
| 85. | 72703 | 7.9% | 5.3%(+2.62)#85 | 8.1%(-0.160)#8,924 |
| 86. | 72937 | 7.9% | 5.3%(+2.62)#86 | 8.1%(-0.160)#8,926 |
| 87. | 72556 | 7.9% | 5.3%(+2.59)#87 | 8.1%(-0.196)#9,005 |
| 88. | 71852 | 7.9% | 5.3%(+2.58)#88 | 8.1%(-0.200)#9,018 |
| 89. | 72732 | 7.7% | 5.3%(+2.40)#89 | 8.1%(-0.379)#9,371 |
| 90. | 71950 | 7.7% | 5.3%(+2.40)#90 | 8.1%(-0.379)#9,381 |
| 91. | 72436 | 7.7% | 5.3%(+2.40)#91 | 8.1%(-0.379)#9,383 |
| 92. | 72626 | 7.7% | 5.3%(+2.36)#92 | 8.1%(-0.421)#9,467 |
| 93. | 72125 | 7.6% | 5.3%(+2.29)#93 | 8.1%(-0.495)#9,620 |
| 94. | 72012 | 7.6% | 5.3%(+2.26)#94 | 8.1%(-0.520)#9,663 |
| 95. | 72390 | 7.5% | 5.3%(+2.18)#95 | 8.1%(-0.606)#9,856 |
| 96. | 72642 | 7.4% | 5.3%(+2.10)#96 | 8.1%(-0.680)#10,018 |
| 97. | 72211 | 7.3% | 5.3%(+2.03)#97 | 8.1%(-0.756)#10,181 |
| 98. | 72206 | 7.3% | 5.3%(+2.02)#98 | 8.1%(-0.766)#10,198 |
| 99. | 72846 | 7.3% | 5.3%(+2.00)#99 | 8.1%(-0.781)#10,235 |
| 100. | 72444 | 7.2% | 5.3%(+1.96)#100 | 8.1%(-0.825)#10,336 |
Common Questions
What are the Top 10 Zip Codes with the Highest Percentage of Population with a Degree in Social Sciences in Arkansas?
Top 10 Zip Codes with the Highest Percentage of Population with a Degree in Social Sciences in Arkansas are:
What zip code has the Highest Percentage of Population with a Degree in Social Sciences in Arkansas?
72629 has the Highest Percentage of Population with a Degree in Social Sciences in Arkansas with 100.0%.
What is the Percentage of Population with a Degree in Social Sciences in the State of Arkansas?
Percentage of Population with a Degree in Social Sciences in Arkansas is 5.3%.
What is the Percentage of Population with a Degree in Social Sciences in the United States?
Percentage of Population with a Degree in Social Sciences in the United States is 8.1%.