Zip Codes with the Highest Percentage of Self-Employed / Incorporated in Arkansas
RELATED REPORTS & OPTIONS
Self-Employed / Incorporated
Arkansas
Compare Zip Codes
Map of Zip Codes with the Highest Percentage of Self-Employed / Incorporated in Arkansas
0.0%
80.0%
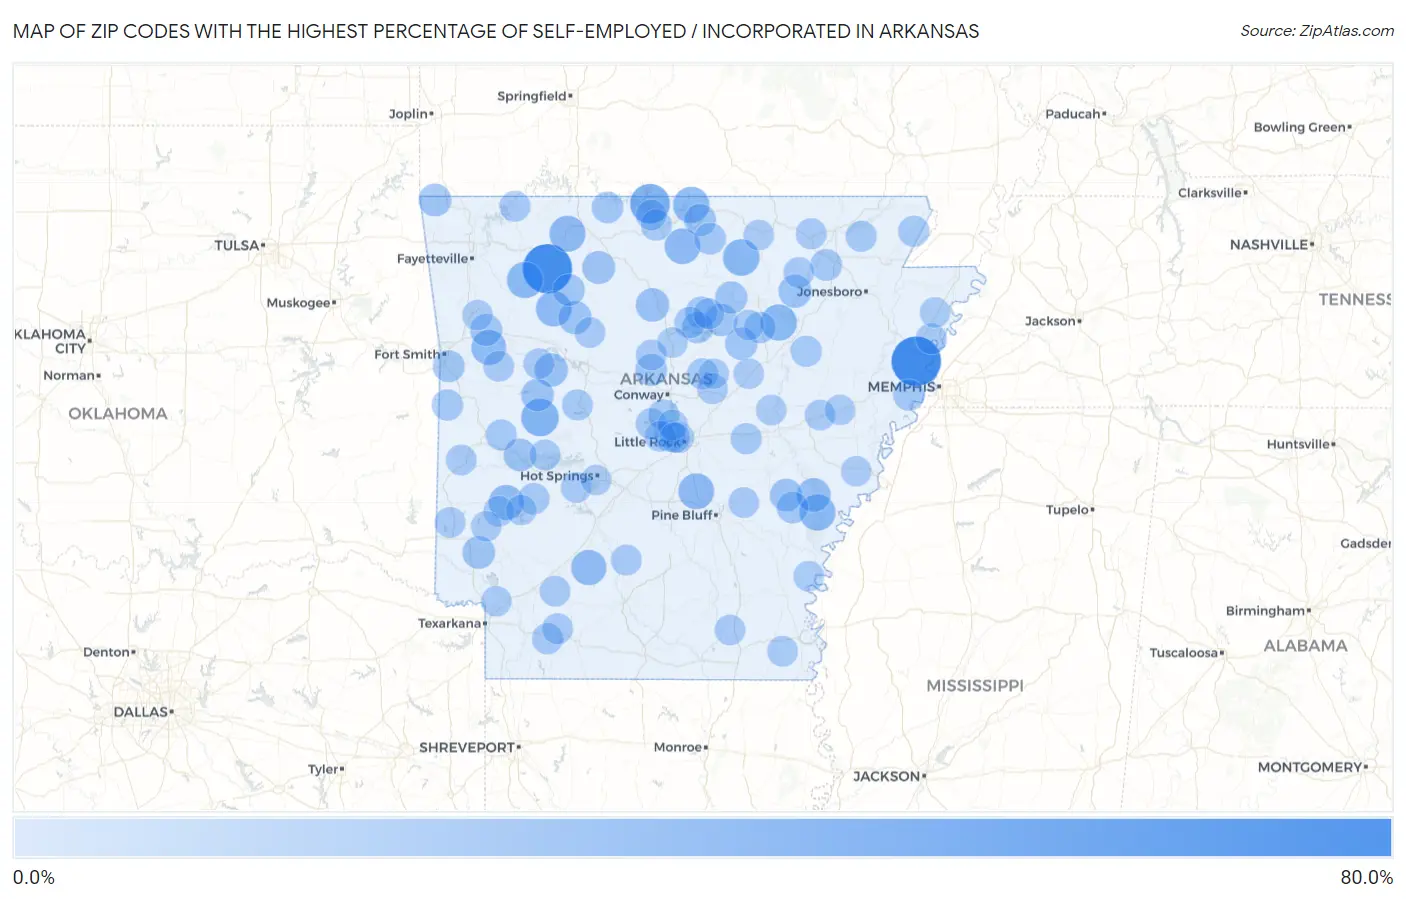
Zip Codes with the Highest Percentage of Self-Employed / Incorporated in Arkansas
| Zip Code | % Self-Employed / Incorporated | vs State | vs National | |
| 1. | 72325 | 75.0% | 3.8% (+71.2)#1 | 3.8% (+71.2)#34 |
| 2. | 72742 | 74.0% | 3.8% (+70.2)#2 | 3.8% (+70.2)#37 |
| 3. | 72661 | 38.9% | 3.8% (+35.1)#3 | 3.8% (+35.1)#138 |
| 4. | 72828 | 31.2% | 3.8% (+27.4)#4 | 3.8% (+27.4)#203 |
| 5. | 72573 | 27.9% | 3.8% (+24.1)#5 | 3.8% (+24.1)#251 |
| 6. | 72537 | 27.2% | 3.8% (+23.4)#6 | 3.8% (+23.4)#266 |
| 7. | 72776 | 26.7% | 3.8% (+22.9)#7 | 3.8% (+22.8)#273 |
| 8. | 72564 | 26.5% | 3.8% (+22.7)#8 | 3.8% (+22.7)#280 |
| 9. | 72048 | 26.3% | 3.8% (+22.4)#9 | 3.8% (+22.4)#285 |
| 10. | 72611 | 26.0% | 3.8% (+22.2)#10 | 3.8% (+22.2)#288 |
| 11. | 72079 | 25.1% | 3.8% (+21.3)#11 | 3.8% (+21.3)#308 |
| 12. | 72658 | 24.2% | 3.8% (+20.4)#12 | 3.8% (+20.4)#333 |
| 13. | 72854 | 24.0% | 3.8% (+20.2)#13 | 3.8% (+20.2)#339 |
| 14. | 71772 | 23.1% | 3.8% (+19.3)#14 | 3.8% (+19.3)#371 |
| 15. | 71952 | 22.7% | 3.8% (+18.9)#15 | 3.8% (+18.9)#383 |
| 16. | 72930 | 22.1% | 3.8% (+18.3)#16 | 3.8% (+18.3)#404 |
| 17. | 72140 | 18.3% | 3.8% (+14.5)#17 | 3.8% (+14.5)#607 |
| 18. | 72629 | 17.0% | 3.8% (+13.2)#18 | 3.8% (+13.2)#704 |
| 19. | 72851 | 16.6% | 3.8% (+12.8)#19 | 3.8% (+12.8)#752 |
| 20. | 72839 | 16.3% | 3.8% (+12.5)#20 | 3.8% (+12.5)#781 |
| 21. | 72524 | 15.1% | 3.8% (+11.3)#21 | 3.8% (+11.3)#939 |
| 22. | 72640 | 15.0% | 3.8% (+11.2)#22 | 3.8% (+11.2)#950 |
| 23. | 72768 | 14.3% | 3.8% (+10.5)#23 | 3.8% (+10.5)#1,065 |
| 24. | 71965 | 14.3% | 3.8% (+10.5)#24 | 3.8% (+10.5)#1,074 |
| 25. | 71846 | 13.9% | 3.8% (+10.1)#25 | 3.8% (+10.1)#1,159 |
| 26. | 72842 | 13.8% | 3.8% (+10.0)#26 | 3.8% (+10.0)#1,167 |
| 27. | 72003 | 13.8% | 3.8% (+9.99)#27 | 3.8% (+9.98)#1,176 |
| 28. | 72530 | 13.3% | 3.8% (+9.52)#28 | 3.8% (+9.50)#1,261 |
| 29. | 72121 | 12.8% | 3.8% (+8.97)#29 | 3.8% (+8.96)#1,363 |
| 30. | 72555 | 12.5% | 3.8% (+8.70)#30 | 3.8% (+8.68)#1,443 |
| 31. | 72947 | 12.1% | 3.8% (+8.34)#31 | 3.8% (+8.32)#1,536 |
| 32. | 72628 | 11.6% | 3.8% (+7.81)#32 | 3.8% (+7.80)#1,686 |
| 33. | 72531 | 11.5% | 3.8% (+7.65)#33 | 3.8% (+7.63)#1,738 |
| 34. | 72916 | 11.1% | 3.8% (+7.29)#34 | 3.8% (+7.27)#1,856 |
| 35. | 72157 | 11.1% | 3.8% (+7.29)#35 | 3.8% (+7.27)#1,857 |
| 36. | 72566 | 10.9% | 3.8% (+7.06)#36 | 3.8% (+7.04)#1,954 |
| 37. | 72042 | 10.8% | 3.8% (+7.04)#37 | 3.8% (+7.02)#1,960 |
| 38. | 72433 | 10.7% | 3.8% (+6.95)#38 | 3.8% (+6.93)#1,995 |
| 39. | 72044 | 10.5% | 3.8% (+6.69)#39 | 3.8% (+6.68)#2,100 |
| 40. | 72644 | 10.0% | 3.8% (+6.20)#40 | 3.8% (+6.18)#2,309 |
| 41. | 72067 | 10.0% | 3.8% (+6.20)#41 | 3.8% (+6.18)#2,310 |
| 42. | 72568 | 9.9% | 3.8% (+6.11)#42 | 3.8% (+6.09)#2,375 |
| 43. | 72376 | 9.8% | 3.8% (+6.01)#43 | 3.8% (+5.99)#2,409 |
| 44. | 72088 | 9.6% | 3.8% (+5.83)#44 | 3.8% (+5.81)#2,507 |
| 45. | 71943 | 9.4% | 3.8% (+5.62)#45 | 3.8% (+5.61)#2,628 |
| 46. | 72938 | 9.3% | 3.8% (+5.51)#46 | 3.8% (+5.49)#2,687 |
| 47. | 72212 | 9.0% | 3.8% (+5.21)#47 | 3.8% (+5.20)#2,874 |
| 48. | 72461 | 8.9% | 3.8% (+5.08)#48 | 3.8% (+5.07)#2,955 |
| 49. | 72135 | 8.9% | 3.8% (+5.08)#49 | 3.8% (+5.06)#2,958 |
| 50. | 72626 | 8.8% | 3.8% (+5.05)#50 | 3.8% (+5.03)#2,976 |
| 51. | 72024 | 8.7% | 3.8% (+4.94)#51 | 3.8% (+4.93)#3,048 |
| 52. | 72106 | 8.6% | 3.8% (+4.83)#52 | 3.8% (+4.82)#3,121 |
| 53. | 71860 | 8.6% | 3.8% (+4.81)#53 | 3.8% (+4.79)#3,141 |
| 54. | 72950 | 8.5% | 3.8% (+4.72)#54 | 3.8% (+4.70)#3,211 |
| 55. | 72169 | 8.5% | 3.8% (+4.71)#55 | 3.8% (+4.69)#3,218 |
| 56. | 72425 | 8.4% | 3.8% (+4.62)#56 | 3.8% (+4.60)#3,300 |
| 57. | 72111 | 8.3% | 3.8% (+4.52)#57 | 3.8% (+4.50)#3,382 |
| 58. | 72853 | 8.1% | 3.8% (+4.32)#58 | 3.8% (+4.30)#3,552 |
| 59. | 71827 | 8.1% | 3.8% (+4.28)#59 | 3.8% (+4.26)#3,594 |
| 60. | 72434 | 8.0% | 3.8% (+4.19)#60 | 3.8% (+4.18)#3,672 |
| 61. | 72350 | 7.9% | 3.8% (+4.11)#61 | 3.8% (+4.09)#3,755 |
| 62. | 72130 | 7.8% | 3.8% (+4.01)#62 | 3.8% (+4.00)#3,846 |
| 63. | 72207 | 7.7% | 3.8% (+3.93)#63 | 3.8% (+3.91)#3,932 |
| 64. | 72631 | 7.7% | 3.8% (+3.86)#64 | 3.8% (+3.84)#4,014 |
| 65. | 71841 | 7.5% | 3.8% (+3.71)#65 | 3.8% (+3.69)#4,160 |
| 66. | 72045 | 7.5% | 3.8% (+3.70)#66 | 3.8% (+3.68)#4,169 |
| 67. | 71763 | 7.5% | 3.8% (+3.65)#67 | 3.8% (+3.64)#4,215 |
| 68. | 72928 | 7.4% | 3.8% (+3.59)#68 | 3.8% (+3.57)#4,285 |
| 69. | 72865 | 7.4% | 3.8% (+3.59)#69 | 3.8% (+3.57)#4,287 |
| 70. | 72619 | 7.4% | 3.8% (+3.58)#70 | 3.8% (+3.57)#4,292 |
| 71. | 71970 | 7.3% | 3.8% (+3.55)#71 | 3.8% (+3.53)#4,339 |
| 72. | 72027 | 7.2% | 3.8% (+3.36)#72 | 3.8% (+3.34)#4,552 |
| 73. | 72469 | 7.1% | 3.8% (+3.34)#73 | 3.8% (+3.33)#4,571 |
| 74. | 72223 | 7.1% | 3.8% (+3.31)#74 | 3.8% (+3.30)#4,619 |
| 75. | 72004 | 7.1% | 3.8% (+3.29)#75 | 3.8% (+3.28)#4,641 |
| 76. | 71964 | 7.1% | 3.8% (+3.27)#76 | 3.8% (+3.26)#4,676 |
| 77. | 71953 | 7.1% | 3.8% (+3.27)#77 | 3.8% (+3.25)#4,679 |
| 78. | 72113 | 7.0% | 3.8% (+3.15)#78 | 3.8% (+3.13)#4,827 |
| 79. | 71674 | 6.9% | 3.8% (+3.14)#79 | 3.8% (+3.13)#4,838 |
| 80. | 71663 | 6.9% | 3.8% (+3.09)#80 | 3.8% (+3.08)#4,900 |
| 81. | 72392 | 6.9% | 3.8% (+3.08)#81 | 3.8% (+3.07)#4,914 |
| 82. | 71835 | 6.9% | 3.8% (+3.07)#82 | 3.8% (+3.05)#4,942 |
| 83. | 71959 | 6.9% | 3.8% (+3.06)#83 | 3.8% (+3.05)#4,948 |
| 84. | 71642 | 6.8% | 3.8% (+3.00)#84 | 3.8% (+2.99)#5,026 |
| 85. | 72837 | 6.8% | 3.8% (+2.96)#85 | 3.8% (+2.94)#5,093 |
| 86. | 72040 | 6.7% | 3.8% (+2.87)#86 | 3.8% (+2.86)#5,228 |
| 87. | 71833 | 6.6% | 3.8% (+2.76)#87 | 3.8% (+2.74)#5,412 |
| 88. | 72513 | 6.5% | 3.8% (+2.72)#88 | 3.8% (+2.70)#5,449 |
| 89. | 72946 | 6.5% | 3.8% (+2.69)#89 | 3.8% (+2.67)#5,492 |
| 90. | 72534 | 6.5% | 3.8% (+2.68)#90 | 3.8% (+2.67)#5,502 |
| 91. | 71913 | 6.4% | 3.8% (+2.62)#91 | 3.8% (+2.61)#5,591 |
| 92. | 71950 | 6.4% | 3.8% (+2.57)#92 | 3.8% (+2.56)#5,668 |
| 93. | 72013 | 6.3% | 3.8% (+2.49)#93 | 3.8% (+2.48)#5,810 |
| 94. | 72227 | 6.3% | 3.8% (+2.48)#94 | 3.8% (+2.47)#5,835 |
| 95. | 72143 | 6.2% | 3.8% (+2.44)#95 | 3.8% (+2.43)#5,909 |
| 96. | 72351 | 6.2% | 3.8% (+2.38)#96 | 3.8% (+2.37)#5,986 |
| 97. | 72372 | 6.1% | 3.8% (+2.34)#97 | 3.8% (+2.33)#6,067 |
| 98. | 71853 | 6.1% | 3.8% (+2.30)#98 | 3.8% (+2.28)#6,151 |
| 99. | 72355 | 6.0% | 3.8% (+2.24)#99 | 3.8% (+2.23)#6,239 |
| 100. | 72136 | 6.0% | 3.8% (+2.23)#100 | 3.8% (+2.22)#6,260 |
Common Questions
What are the Top 10 Zip Codes with the Highest Percentage of Self-Employed / Incorporated in Arkansas?
Top 10 Zip Codes with the Highest Percentage of Self-Employed / Incorporated in Arkansas are:
What zip code has the Highest Percentage of Self-Employed / Incorporated in Arkansas?
72325 has the Highest Percentage of Self-Employed / Incorporated in Arkansas with 75.0%.
What is the Percentage of Self-Employed / Incorporated in the State of Arkansas?
Percentage of Self-Employed / Incorporated in Arkansas is 3.8%.
What is the Percentage of Self-Employed / Incorporated in the United States?
Percentage of Self-Employed / Incorporated in the United States is 3.8%.