Zip Codes with the Highest Percentage of Scotch-Irish Population in Arkansas
RELATED REPORTS & OPTIONS
Scotch-Irish
Arkansas
Compare Zip Codes
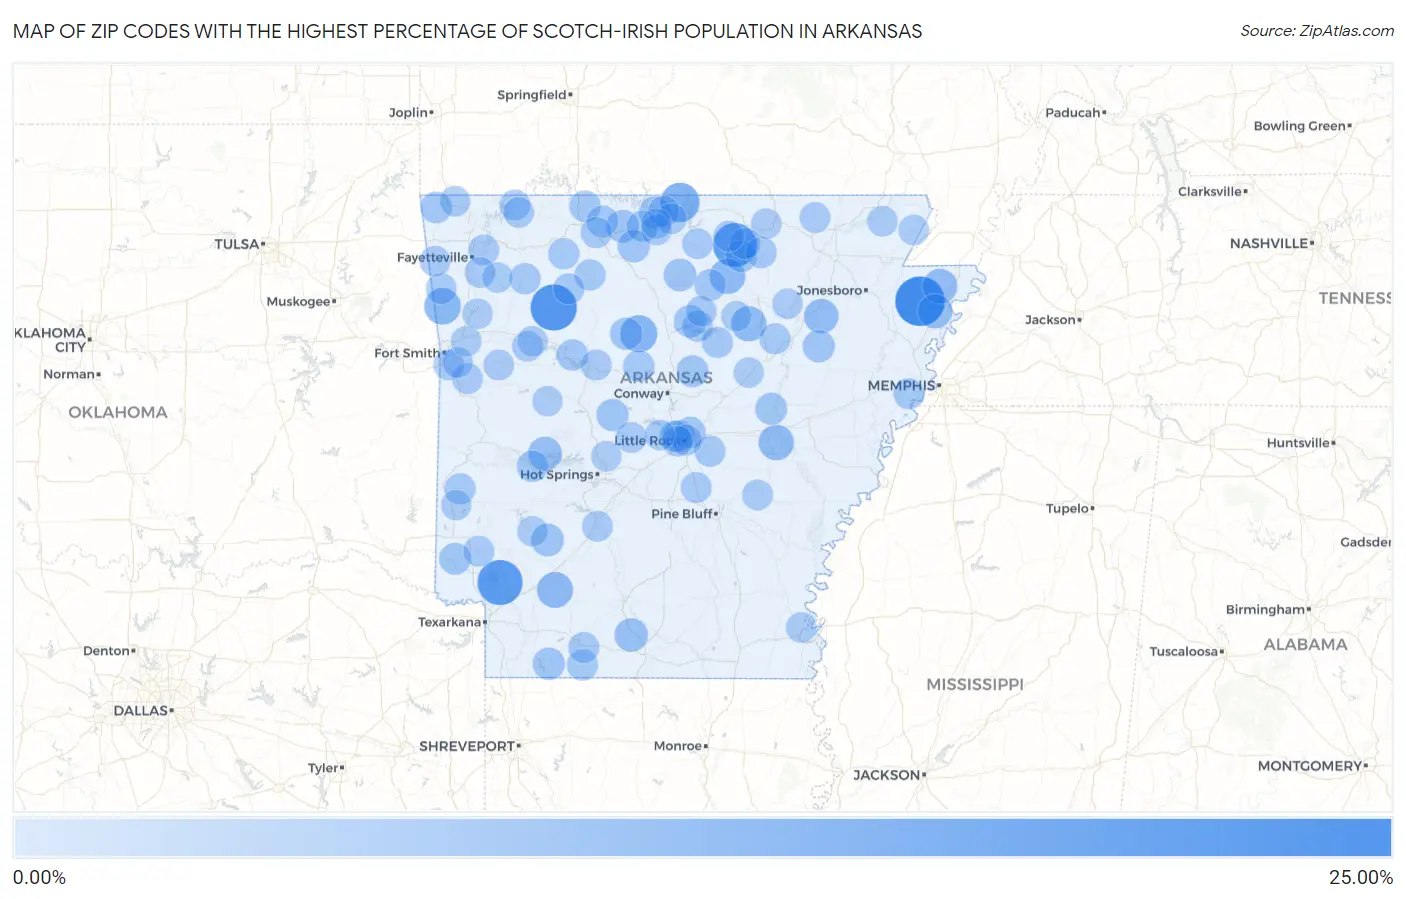
Map of Zip Codes with the Highest Percentage of Scotch-Irish Population in Arkansas
0.00%
25.00%
Zip Codes with the Highest Percentage of Scotch-Irish Population in Arkansas
| Zip Code | Scotch-Irish | vs State | vs National | |
| 1. | 72428 | 24.79% | 0.97%(+23.8)#1 | 0.82%(+24.0)#44 |
| 2. | 72854 | 20.70% | 0.97%(+19.7)#2 | 0.82%(+19.9)#57 |
| 3. | 71859 | 19.26% | 0.97%(+18.3)#3 | 0.82%(+18.4)#63 |
| 4. | 72584 | 17.87% | 0.97%(+16.9)#4 | 0.82%(+17.0)#70 |
| 5. | 72623 | 12.00% | 0.97%(+11.0)#5 | 0.82%(+11.2)#146 |
| 6. | 72141 | 9.48% | 0.97%(+8.51)#6 | 0.82%(+8.66)#247 |
| 7. | 72948 | 8.81% | 0.97%(+7.84)#7 | 0.82%(+7.99)#282 |
| 8. | 71835 | 8.02% | 0.97%(+7.05)#8 | 0.82%(+7.20)#339 |
| 9. | 72540 | 7.56% | 0.97%(+6.59)#9 | 0.82%(+6.75)#383 |
| 10. | 72041 | 7.43% | 0.97%(+6.46)#10 | 0.82%(+6.62)#392 |
| 11. | 72534 | 7.31% | 0.97%(+6.34)#11 | 0.82%(+6.49)#403 |
| 12. | 72426 | 6.74% | 0.97%(+5.77)#12 | 0.82%(+5.92)#453 |
| 13. | 72431 | 6.35% | 0.97%(+5.38)#13 | 0.82%(+5.53)#503 |
| 14. | 72351 | 6.32% | 0.97%(+5.35)#14 | 0.82%(+5.50)#508 |
| 15. | 71970 | 5.65% | 0.97%(+4.68)#15 | 0.82%(+4.83)#620 |
| 16. | 71762 | 4.99% | 0.97%(+4.02)#16 | 0.82%(+4.17)#766 |
| 17. | 71940 | 4.26% | 0.97%(+3.29)#17 | 0.82%(+3.44)#1,017 |
| 18. | 72672 | 4.17% | 0.97%(+3.20)#18 | 0.82%(+3.35)#1,059 |
| 19. | 72663 | 4.14% | 0.97%(+3.17)#19 | 0.82%(+3.32)#1,066 |
| 20. | 71861 | 3.85% | 0.97%(+2.88)#20 | 0.82%(+3.03)#1,213 |
| 21. | 72682 | 3.80% | 0.97%(+2.83)#21 | 0.82%(+2.98)#1,243 |
| 22. | 72088 | 3.77% | 0.97%(+2.80)#22 | 0.82%(+2.95)#1,261 |
| 23. | 72642 | 3.72% | 0.97%(+2.75)#23 | 0.82%(+2.90)#1,294 |
| 24. | 72014 | 3.70% | 0.97%(+2.73)#24 | 0.82%(+2.89)#1,306 |
| 25. | 72126 | 3.61% | 0.97%(+2.64)#25 | 0.82%(+2.79)#1,369 |
| 26. | 72080 | 3.59% | 0.97%(+2.62)#26 | 0.82%(+2.77)#1,382 |
| 27. | 72040 | 3.38% | 0.97%(+2.41)#27 | 0.82%(+2.56)#1,547 |
| 28. | 72207 | 3.25% | 0.97%(+2.28)#28 | 0.82%(+2.43)#1,673 |
| 29. | 72047 | 3.17% | 0.97%(+2.20)#29 | 0.82%(+2.35)#1,764 |
| 30. | 71842 | 3.11% | 0.97%(+2.14)#30 | 0.82%(+2.29)#1,831 |
| 31. | 72560 | 2.95% | 0.97%(+1.98)#31 | 0.82%(+2.13)#2,008 |
| 32. | 72736 | 2.84% | 0.97%(+1.87)#32 | 0.82%(+2.03)#2,149 |
| 33. | 71957 | 2.82% | 0.97%(+1.85)#33 | 0.82%(+2.00)#2,183 |
| 34. | 72662 | 2.80% | 0.97%(+1.83)#34 | 0.82%(+1.99)#2,203 |
| 35. | 72573 | 2.79% | 0.97%(+1.82)#35 | 0.82%(+1.97)#2,220 |
| 36. | 72615 | 2.78% | 0.97%(+1.81)#36 | 0.82%(+1.96)#2,237 |
| 37. | 72687 | 2.77% | 0.97%(+1.80)#37 | 0.82%(+1.96)#2,239 |
| 38. | 72116 | 2.72% | 0.97%(+1.75)#38 | 0.82%(+1.90)#2,309 |
| 39. | 72847 | 2.70% | 0.97%(+1.73)#39 | 0.82%(+1.89)#2,324 |
| 40. | 72156 | 2.56% | 0.97%(+1.59)#40 | 0.82%(+1.74)#2,573 |
| 41. | 72067 | 2.43% | 0.97%(+1.46)#41 | 0.82%(+1.61)#2,787 |
| 42. | 72776 | 2.42% | 0.97%(+1.45)#42 | 0.82%(+1.61)#2,800 |
| 43. | 72532 | 2.39% | 0.97%(+1.42)#43 | 0.82%(+1.57)#2,843 |
| 44. | 72624 | 2.38% | 0.97%(+1.41)#44 | 0.82%(+1.56)#2,872 |
| 45. | 72601 | 2.34% | 0.97%(+1.37)#45 | 0.82%(+1.53)#2,940 |
| 46. | 72536 | 2.34% | 0.97%(+1.37)#46 | 0.82%(+1.52)#2,955 |
| 47. | 71740 | 2.34% | 0.97%(+1.37)#47 | 0.82%(+1.52)#2,959 |
| 48. | 72683 | 2.31% | 0.97%(+1.34)#48 | 0.82%(+1.50)#3,009 |
| 49. | 71972 | 2.24% | 0.97%(+1.27)#49 | 0.82%(+1.43)#3,163 |
| 50. | 72142 | 2.24% | 0.97%(+1.27)#50 | 0.82%(+1.43)#3,164 |
| 51. | 72543 | 2.18% | 0.97%(+1.21)#51 | 0.82%(+1.37)#3,307 |
| 52. | 72020 | 2.18% | 0.97%(+1.21)#52 | 0.82%(+1.36)#3,317 |
| 53. | 71753 | 2.18% | 0.97%(+1.21)#53 | 0.82%(+1.36)#3,321 |
| 54. | 72227 | 2.14% | 0.97%(+1.17)#54 | 0.82%(+1.32)#3,407 |
| 55. | 72376 | 2.13% | 0.97%(+1.16)#55 | 0.82%(+1.31)#3,444 |
| 56. | 72628 | 2.12% | 0.97%(+1.15)#56 | 0.82%(+1.31)#3,452 |
| 57. | 72202 | 2.10% | 0.97%(+1.13)#57 | 0.82%(+1.29)#3,510 |
| 58. | 71846 | 2.07% | 0.97%(+1.10)#58 | 0.82%(+1.25)#3,608 |
| 59. | 72651 | 2.06% | 0.97%(+1.09)#59 | 0.82%(+1.24)#3,642 |
| 60. | 72073 | 2.03% | 0.97%(+1.06)#60 | 0.82%(+1.21)#3,718 |
| 61. | 72936 | 2.00% | 0.97%(+1.03)#61 | 0.82%(+1.18)#3,818 |
| 62. | 72802 | 1.99% | 0.97%(+1.02)#62 | 0.82%(+1.17)#3,878 |
| 63. | 72132 | 1.97% | 0.97%(+0.997)#63 | 0.82%(+1.15)#3,945 |
| 64. | 72634 | 1.96% | 0.97%(+0.988)#64 | 0.82%(+1.14)#3,979 |
| 65. | 72653 | 1.95% | 0.97%(+0.976)#65 | 0.82%(+1.13)#4,005 |
| 66. | 72717 | 1.94% | 0.97%(+0.974)#66 | 0.82%(+1.13)#4,011 |
| 67. | 72460 | 1.92% | 0.97%(+0.950)#67 | 0.82%(+1.10)#4,098 |
| 68. | 72565 | 1.92% | 0.97%(+0.947)#68 | 0.82%(+1.10)#4,104 |
| 69. | 72122 | 1.88% | 0.97%(+0.909)#69 | 0.82%(+1.06)#4,236 |
| 70. | 71999 | 1.87% | 0.97%(+0.905)#70 | 0.82%(+1.06)#4,247 |
| 71. | 72703 | 1.87% | 0.97%(+0.898)#71 | 0.82%(+1.05)#4,265 |
| 72. | 72928 | 1.84% | 0.97%(+0.867)#72 | 0.82%(+1.02)#4,379 |
| 73. | 72916 | 1.83% | 0.97%(+0.863)#73 | 0.82%(+1.02)#4,392 |
| 74. | 72631 | 1.83% | 0.97%(+0.855)#74 | 0.82%(+1.01)#4,423 |
| 75. | 72832 | 1.82% | 0.97%(+0.853)#75 | 0.82%(+1.01)#4,432 |
| 76. | 72923 | 1.80% | 0.97%(+0.825)#76 | 0.82%(+0.978)#4,524 |
| 77. | 72769 | 1.79% | 0.97%(+0.822)#77 | 0.82%(+0.974)#4,530 |
| 78. | 72044 | 1.76% | 0.97%(+0.791)#78 | 0.82%(+0.944)#4,653 |
| 79. | 72519 | 1.76% | 0.97%(+0.786)#79 | 0.82%(+0.938)#4,683 |
| 80. | 72701 | 1.73% | 0.97%(+0.763)#80 | 0.82%(+0.915)#4,770 |
| 81. | 72205 | 1.73% | 0.97%(+0.760)#81 | 0.82%(+0.912)#4,785 |
| 82. | 72435 | 1.72% | 0.97%(+0.746)#82 | 0.82%(+0.899)#4,842 |
| 83. | 72461 | 1.68% | 0.97%(+0.712)#83 | 0.82%(+0.864)#4,994 |
| 84. | 72715 | 1.68% | 0.97%(+0.708)#84 | 0.82%(+0.860)#5,003 |
| 85. | 72632 | 1.66% | 0.97%(+0.689)#85 | 0.82%(+0.841)#5,100 |
| 86. | 72626 | 1.64% | 0.97%(+0.674)#86 | 0.82%(+0.826)#5,173 |
| 87. | 72529 | 1.61% | 0.97%(+0.639)#87 | 0.82%(+0.792)#5,316 |
| 88. | 71958 | 1.59% | 0.97%(+0.624)#88 | 0.82%(+0.776)#5,396 |
| 89. | 72223 | 1.59% | 0.97%(+0.615)#89 | 0.82%(+0.767)#5,447 |
| 90. | 72921 | 1.58% | 0.97%(+0.614)#90 | 0.82%(+0.766)#5,455 |
| 91. | 71909 | 1.57% | 0.97%(+0.598)#91 | 0.82%(+0.751)#5,545 |
| 92. | 71653 | 1.55% | 0.97%(+0.581)#92 | 0.82%(+0.734)#5,649 |
| 93. | 72727 | 1.50% | 0.97%(+0.534)#93 | 0.82%(+0.687)#5,903 |
| 94. | 72946 | 1.50% | 0.97%(+0.526)#94 | 0.82%(+0.679)#5,945 |
| 95. | 72840 | 1.46% | 0.97%(+0.486)#95 | 0.82%(+0.638)#6,181 |
| 96. | 72523 | 1.45% | 0.97%(+0.483)#96 | 0.82%(+0.635)#6,201 |
| 97. | 72562 | 1.44% | 0.97%(+0.472)#97 | 0.82%(+0.625)#6,252 |
| 98. | 72143 | 1.44% | 0.97%(+0.465)#98 | 0.82%(+0.618)#6,291 |
| 99. | 71973 | 1.43% | 0.97%(+0.460)#99 | 0.82%(+0.613)#6,324 |
| 100. | 72833 | 1.42% | 0.97%(+0.449)#100 | 0.82%(+0.601)#6,402 |
Common Questions
What are the Top 10 Zip Codes with the Highest Percentage of Scotch-Irish Population in Arkansas?
Top 10 Zip Codes with the Highest Percentage of Scotch-Irish Population in Arkansas are:
What zip code has the Highest Percentage of Scotch-Irish Population in Arkansas?
72428 has the Highest Percentage of Scotch-Irish Population in Arkansas with 24.79%.
What is the Percentage of Scotch-Irish Population in the State of Arkansas?
Percentage of Scotch-Irish Population in Arkansas is 0.97%.
What is the Percentage of Scotch-Irish Population in the United States?
Percentage of Scotch-Irish Population in the United States is 0.82%.