Zip Codes with the Highest Percentage of Population Employed in Architecture & Engineering in Cheyenne, WY
RELATED REPORTS & OPTIONS
Architecture & Engineering
Cheyenne
Compare Zip Codes
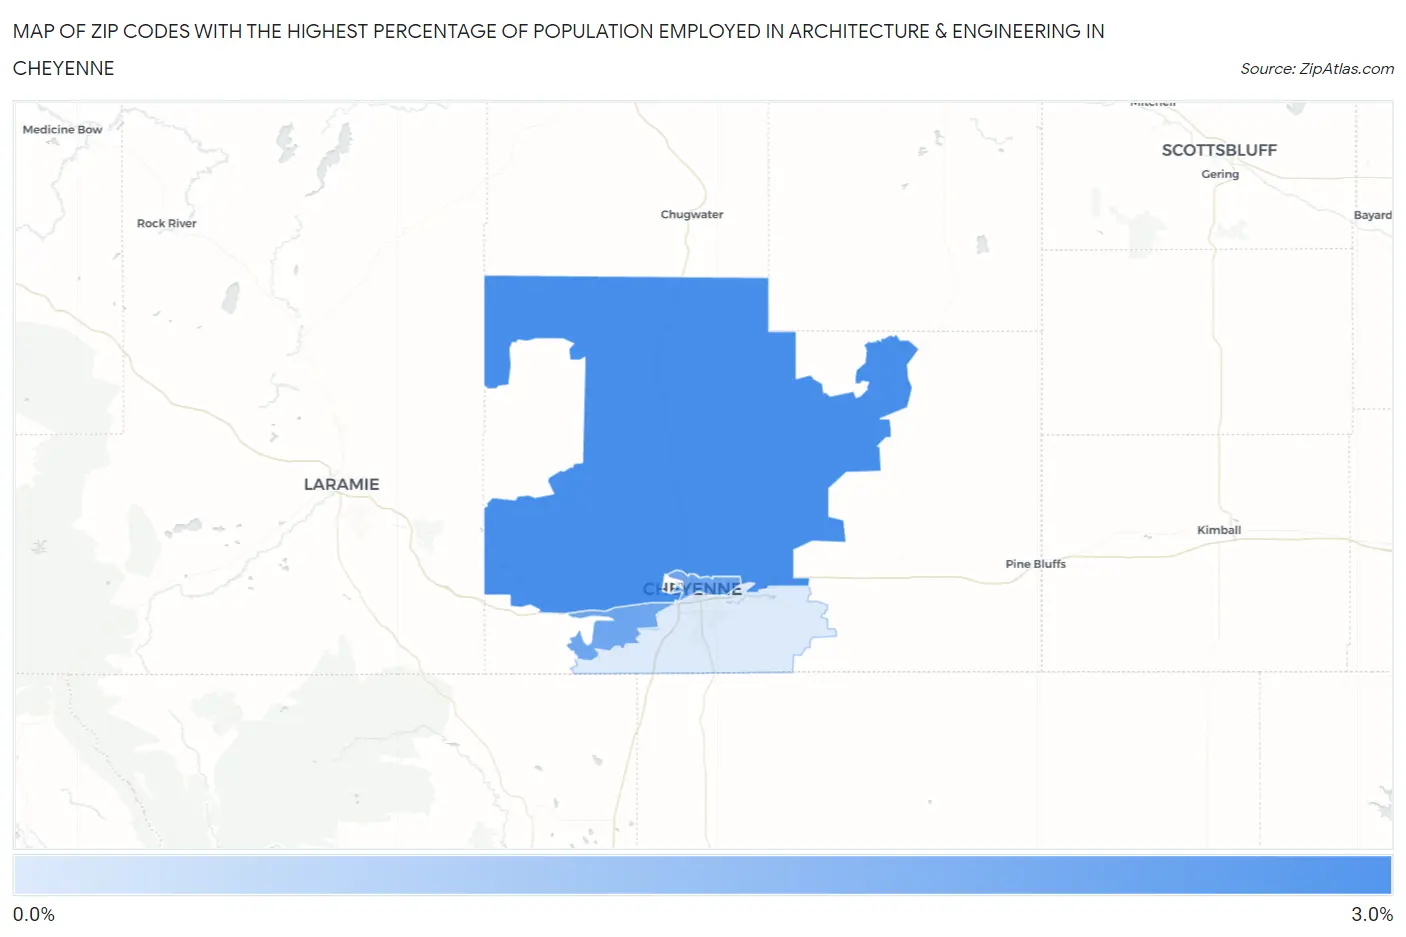
Map of Zip Codes with the Highest Percentage of Population Employed in Architecture & Engineering in Cheyenne
0.29%
2.8%
Zip Codes with the Highest Percentage of Population Employed in Architecture & Engineering in Cheyenne, WY
| Zip Code | % Employed | vs State | vs National | |
| 1. | 82009 | 2.8% | 1.9%(+0.891)#18 | 2.1%(+0.669)#5,716 |
| 2. | 82001 | 2.2% | 1.9%(+0.238)#31 | 2.1%(+0.015)#8,679 |
| 3. | 82007 | 0.29% | 1.9%(-1.63)#71 | 2.1%(-1.85)#21,589 |
1
Common Questions
What are the Top Zip Codes with the Highest Percentage of Population Employed in Architecture & Engineering in Cheyenne, WY?
Top Zip Codes with the Highest Percentage of Population Employed in Architecture & Engineering in Cheyenne, WY are:
What zip code has the Highest Percentage of Population Employed in Architecture & Engineering in Cheyenne, WY?
82009 has the Highest Percentage of Population Employed in Architecture & Engineering in Cheyenne, WY with 2.8%.
What is the Percentage of Population Employed in Architecture & Engineering in Cheyenne, WY?
Percentage of Population Employed in Architecture & Engineering in Cheyenne is 2.2%.
What is the Percentage of Population Employed in Architecture & Engineering in Wyoming?
Percentage of Population Employed in Architecture & Engineering in Wyoming is 1.9%.
What is the Percentage of Population Employed in Architecture & Engineering in the United States?
Percentage of Population Employed in Architecture & Engineering in the United States is 2.1%.