Zip Codes with the Highest Percentage of Population with a Degree in Visual and Performing Arts in Kirkland, WA
RELATED REPORTS & OPTIONS
Visual and Performing Arts
Kirkland
Compare Zip Codes
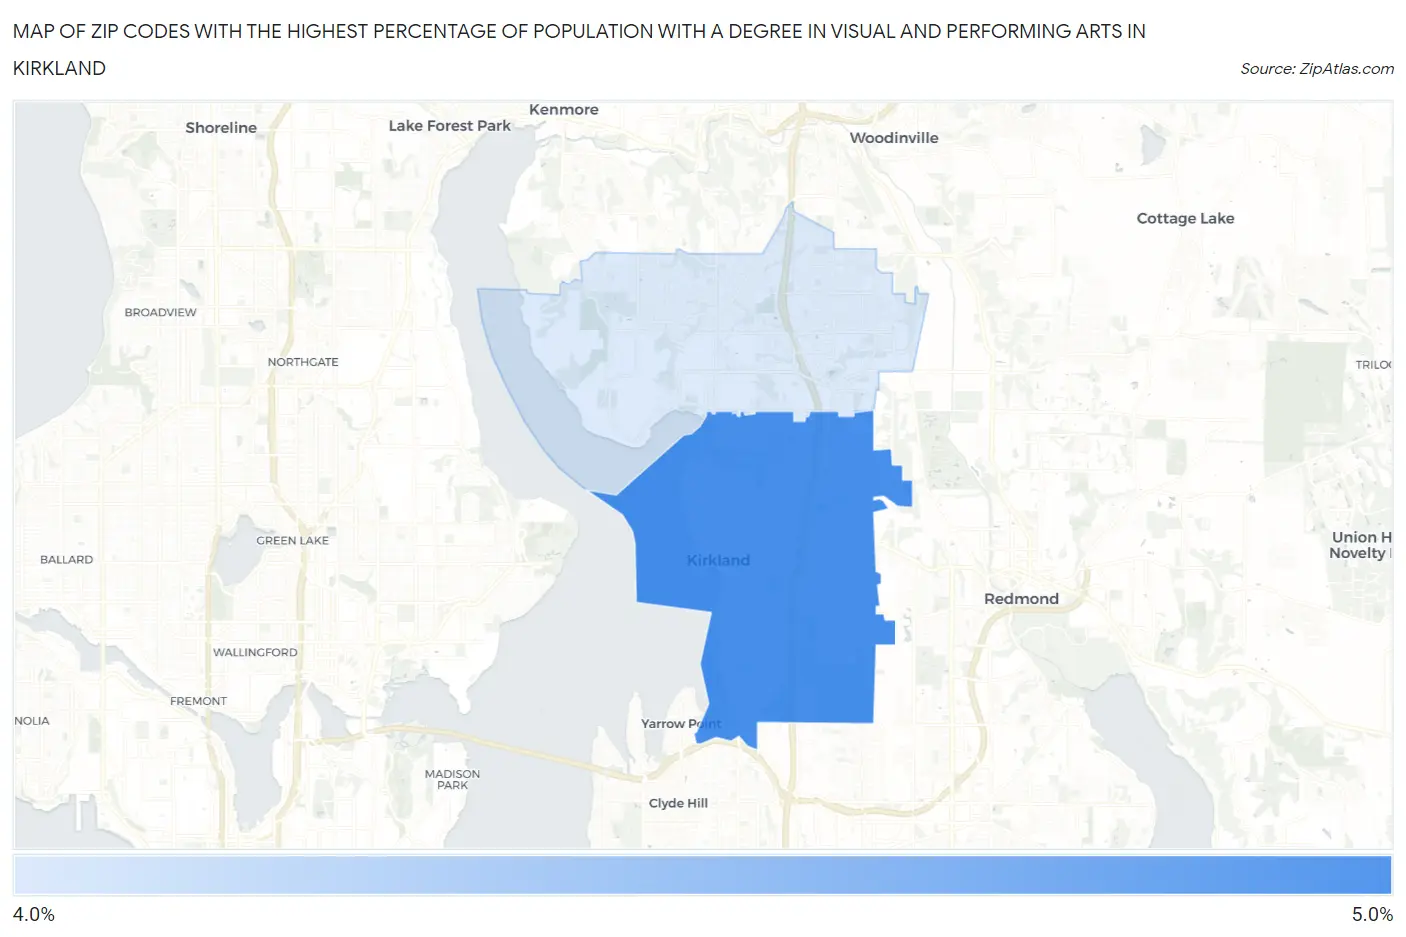
Map of Zip Codes with the Highest Percentage of Population with a Degree in Visual and Performing Arts in Kirkland
4.4%
4.4%
Zip Codes with the Highest Percentage of Population with a Degree in Visual and Performing Arts in Kirkland, WA
| Zip Code | % Graduates | vs State | vs National | |
| 1. | 98033 | 4.4% | 4.6%(-0.170)#204 | 4.3%(+0.197)#7,945 |
| 2. | 98034 | 4.4% | 4.6%(-0.261)#212 | 4.3%(+0.106)#8,196 |
1
Common Questions
What are the Top Zip Codes with the Highest Percentage of Population with a Degree in Visual and Performing Arts in Kirkland, WA?
Top Zip Codes with the Highest Percentage of Population with a Degree in Visual and Performing Arts in Kirkland, WA are:
What zip code has the Highest Percentage of Population with a Degree in Visual and Performing Arts in Kirkland, WA?
98033 has the Highest Percentage of Population with a Degree in Visual and Performing Arts in Kirkland, WA with 4.4%.
What is the Percentage of Population with a Degree in Visual and Performing Arts in Kirkland, WA?
Percentage of Population with a Degree in Visual and Performing Arts in Kirkland is 4.4%.
What is the Percentage of Population with a Degree in Visual and Performing Arts in Washington?
Percentage of Population with a Degree in Visual and Performing Arts in Washington is 4.6%.
What is the Percentage of Population with a Degree in Visual and Performing Arts in the United States?
Percentage of Population with a Degree in Visual and Performing Arts in the United States is 4.3%.