Zip Codes with the Highest Percentage of Population Employed in Health Diagnosing & Treating in Chantilly, VA
RELATED REPORTS & OPTIONS
Health Diagnosing & Treating
Chantilly
Compare Zip Codes
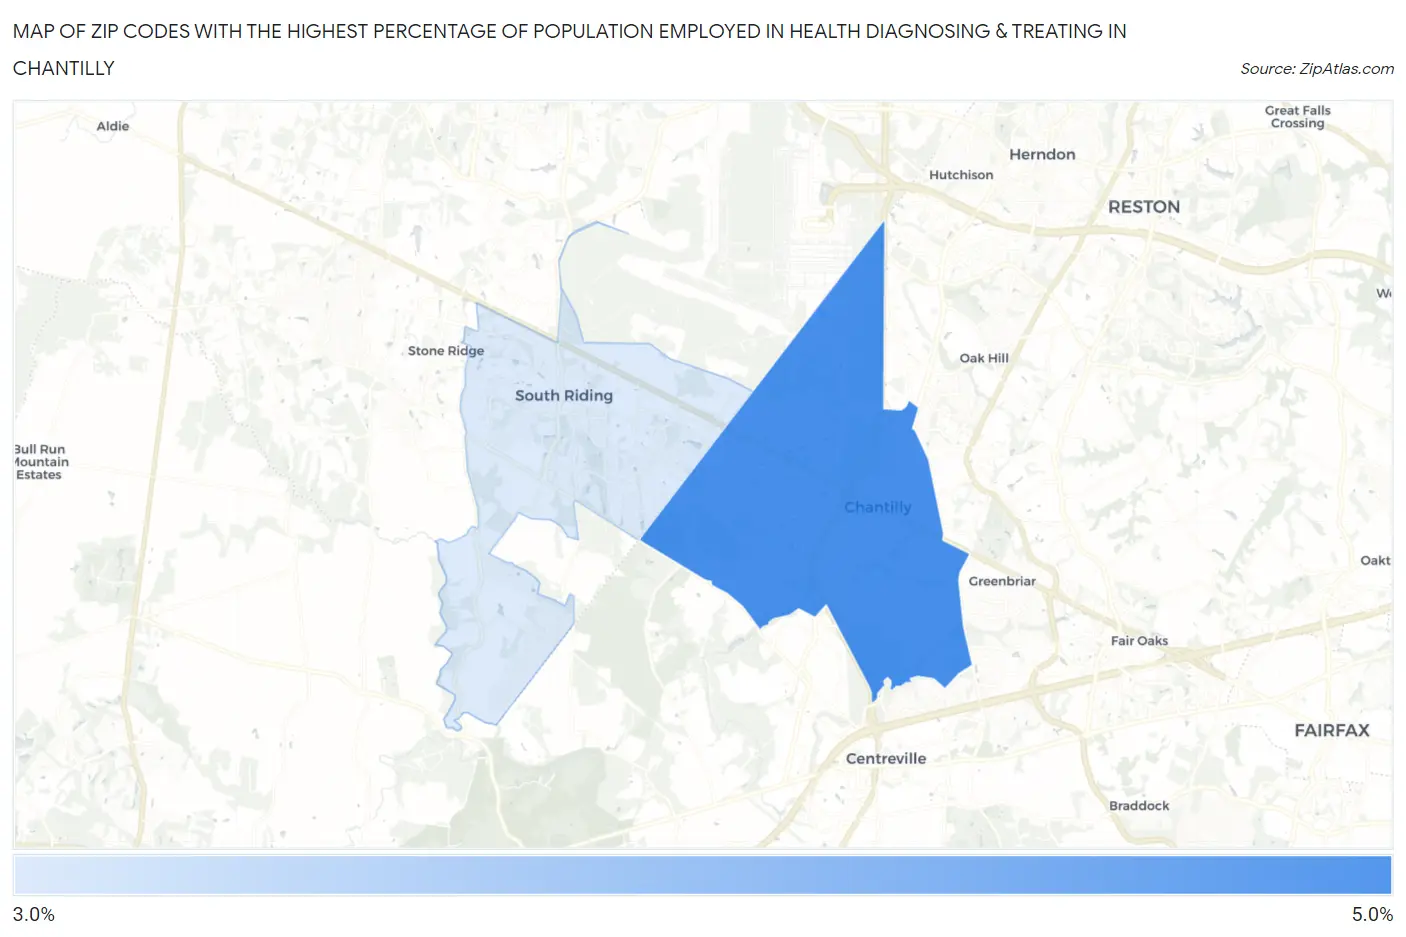
Map of Zip Codes with the Highest Percentage of Population Employed in Health Diagnosing & Treating in Chantilly
3.7%
4.0%
Zip Codes with the Highest Percentage of Population Employed in Health Diagnosing & Treating in Chantilly, VA
| Zip Code | % Employed | vs State | vs National | |
| 1. | 20151 | 4.0% | 5.7%(-1.64)#531 | 6.2%(-2.23)#21,330 |
| 2. | 20152 | 3.7% | 5.7%(-1.95)#568 | 6.2%(-2.54)#22,277 |
1
Common Questions
What are the Top Zip Codes with the Highest Percentage of Population Employed in Health Diagnosing & Treating in Chantilly, VA?
Top Zip Codes with the Highest Percentage of Population Employed in Health Diagnosing & Treating in Chantilly, VA are:
What zip code has the Highest Percentage of Population Employed in Health Diagnosing & Treating in Chantilly, VA?
20151 has the Highest Percentage of Population Employed in Health Diagnosing & Treating in Chantilly, VA with 4.0%.
What is the Percentage of Population Employed in Health Diagnosing & Treating in Chantilly, VA?
Percentage of Population Employed in Health Diagnosing & Treating in Chantilly is 4.6%.
What is the Percentage of Population Employed in Health Diagnosing & Treating in Virginia?
Percentage of Population Employed in Health Diagnosing & Treating in Virginia is 5.7%.
What is the Percentage of Population Employed in Health Diagnosing & Treating in the United States?
Percentage of Population Employed in Health Diagnosing & Treating in the United States is 6.2%.