Zip Codes with the Highest Percentage of Population Employed in Computer & Mathematics in Chantilly, VA
RELATED REPORTS & OPTIONS
Computer & Mathematics
Chantilly
Compare Zip Codes
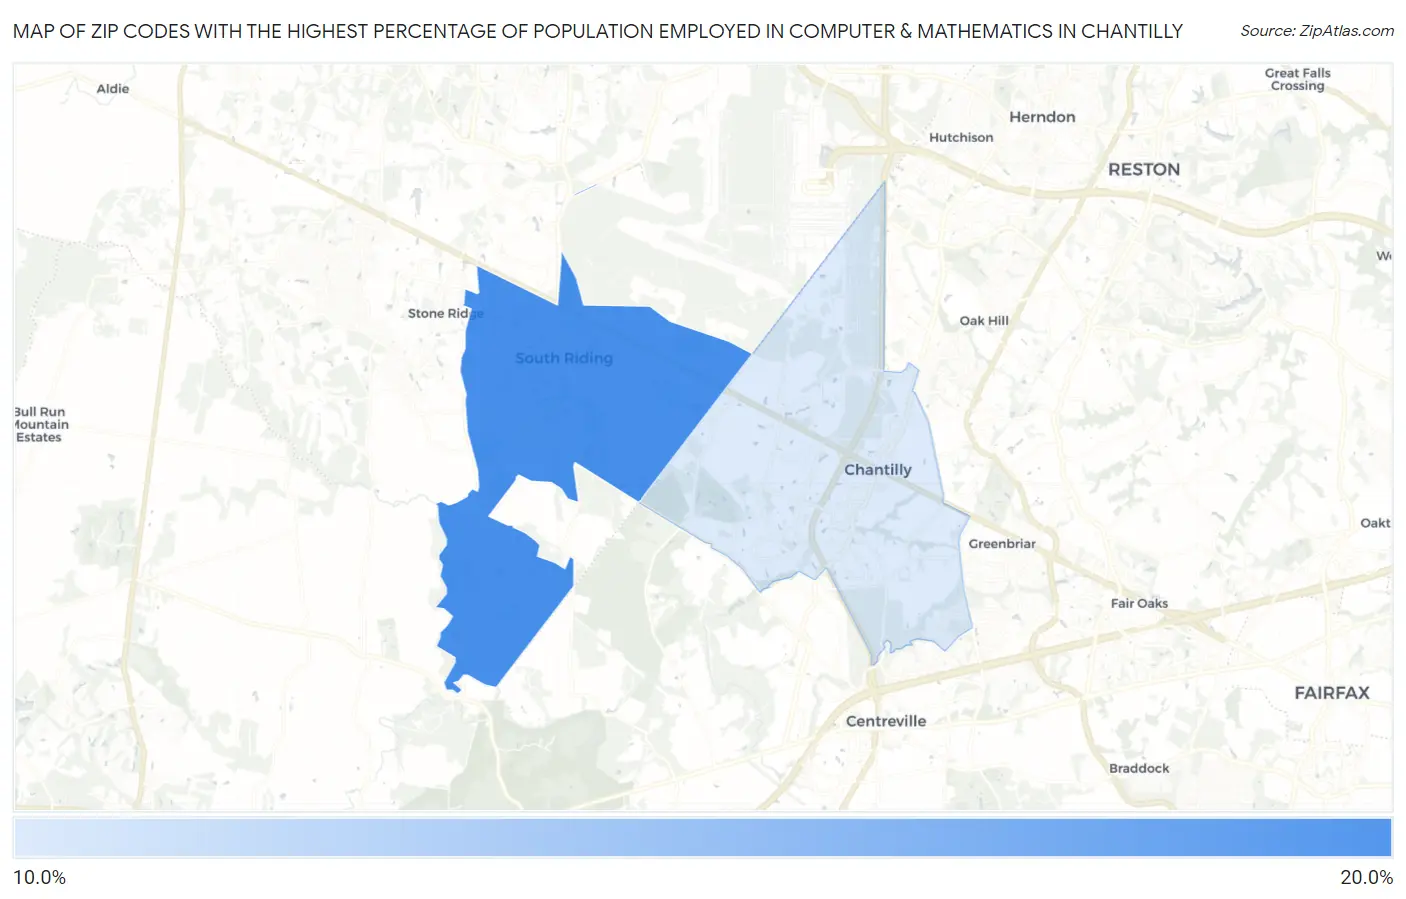
Map of Zip Codes with the Highest Percentage of Population Employed in Computer & Mathematics in Chantilly
11.1%
19.4%
Zip Codes with the Highest Percentage of Population Employed in Computer & Mathematics in Chantilly, VA
| Zip Code | % Employed | vs State | vs National | |
| 1. | 20152 | 19.4% | 6.2%(+13.2)#4 | 3.5%(+15.9)#141 |
| 2. | 20151 | 11.1% | 6.2%(+4.90)#48 | 3.5%(+7.61)#543 |
1
Common Questions
What are the Top Zip Codes with the Highest Percentage of Population Employed in Computer & Mathematics in Chantilly, VA?
Top Zip Codes with the Highest Percentage of Population Employed in Computer & Mathematics in Chantilly, VA are:
What zip code has the Highest Percentage of Population Employed in Computer & Mathematics in Chantilly, VA?
20152 has the Highest Percentage of Population Employed in Computer & Mathematics in Chantilly, VA with 19.4%.
What is the Percentage of Population Employed in Computer & Mathematics in Chantilly, VA?
Percentage of Population Employed in Computer & Mathematics in Chantilly is 11.4%.
What is the Percentage of Population Employed in Computer & Mathematics in Virginia?
Percentage of Population Employed in Computer & Mathematics in Virginia is 6.2%.
What is the Percentage of Population Employed in Computer & Mathematics in the United States?
Percentage of Population Employed in Computer & Mathematics in the United States is 3.5%.