Zip Codes with the Highest Percentage of Households with Income Above $100,000 in Mcallen, TX
RELATED REPORTS & OPTIONS
Household Income | $100k+
Mcallen
Compare Zip Codes
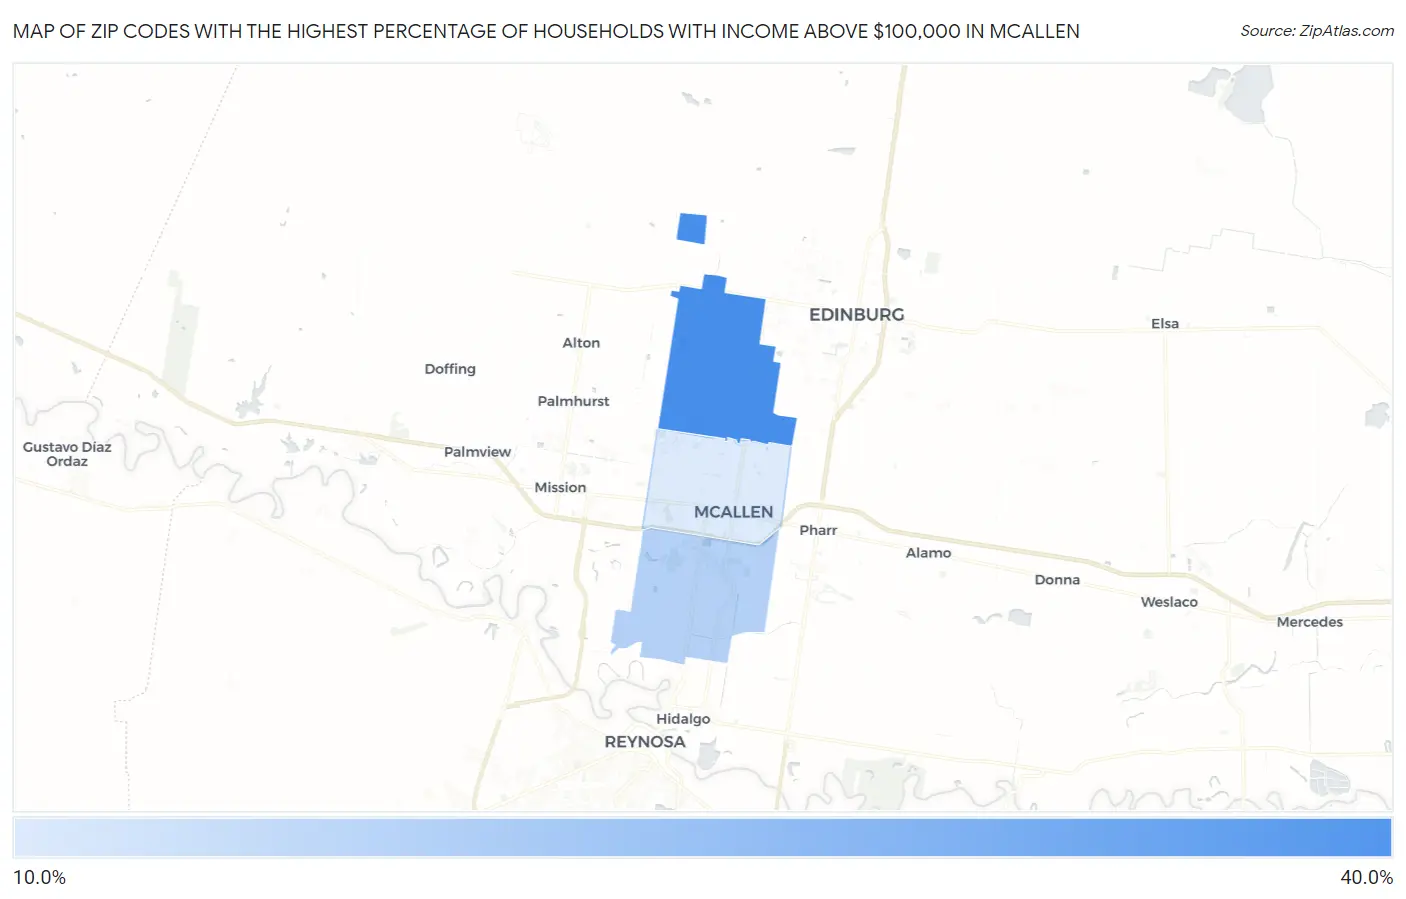
Map of Zip Codes with the Highest Percentage of Households with Income Above $100,000 in Mcallen
17.8%
37.5%
Zip Codes with the Highest Percentage of Households with Income Above $100,000 in Mcallen, TX
| Zip Code | Households with Income > $100k | vs State | vs National | |
| 1. | 78504 | 37.5% | 36.2%(+1.30)#568 | 37.3%(+0.200)#10,246 |
| 2. | 78503 | 22.9% | 36.2%(-13.3)#1,246 | 37.3%(-14.4)#21,650 |
| 3. | 78501 | 17.8% | 36.2%(-18.4)#1,494 | 37.3%(-19.5)#25,679 |
1
Common Questions
What are the Top Zip Codes with the Highest Percentage of Households with Income Above $100,000 in Mcallen, TX?
Top Zip Codes with the Highest Percentage of Households with Income Above $100,000 in Mcallen, TX are:
What zip code has the Highest Percentage of Households with Income Above $100,000 in Mcallen, TX?
78504 has the Highest Percentage of Households with Income Above $100,000 in Mcallen, TX with 37.5%.
What is the Percentage of Households with Income Above $100,000 in Mcallen, TX?
Percentage of Households with Income Above $100,000 in Mcallen is 26.5%.
What is the Percentage of Households with Income Above $100,000 in Texas?
Percentage of Households with Income Above $100,000 in Texas is 36.2%.
What is the Percentage of Households with Income Above $100,000 in the United States?
Percentage of Households with Income Above $100,000 in the United States is 37.3%.