Chickasaw vs Spanish Receiving Food Stamps
COMPARE
Chickasaw
Spanish
Receiving Food Stamps
Receiving Food Stamps Comparison
Chickasaw
Spanish
13.1%
RECEIVING FOOD STAMPS
3.6/ 100
METRIC RATING
226th/ 347
METRIC RANK
12.0%
RECEIVING FOOD STAMPS
36.9/ 100
METRIC RATING
186th/ 347
METRIC RANK
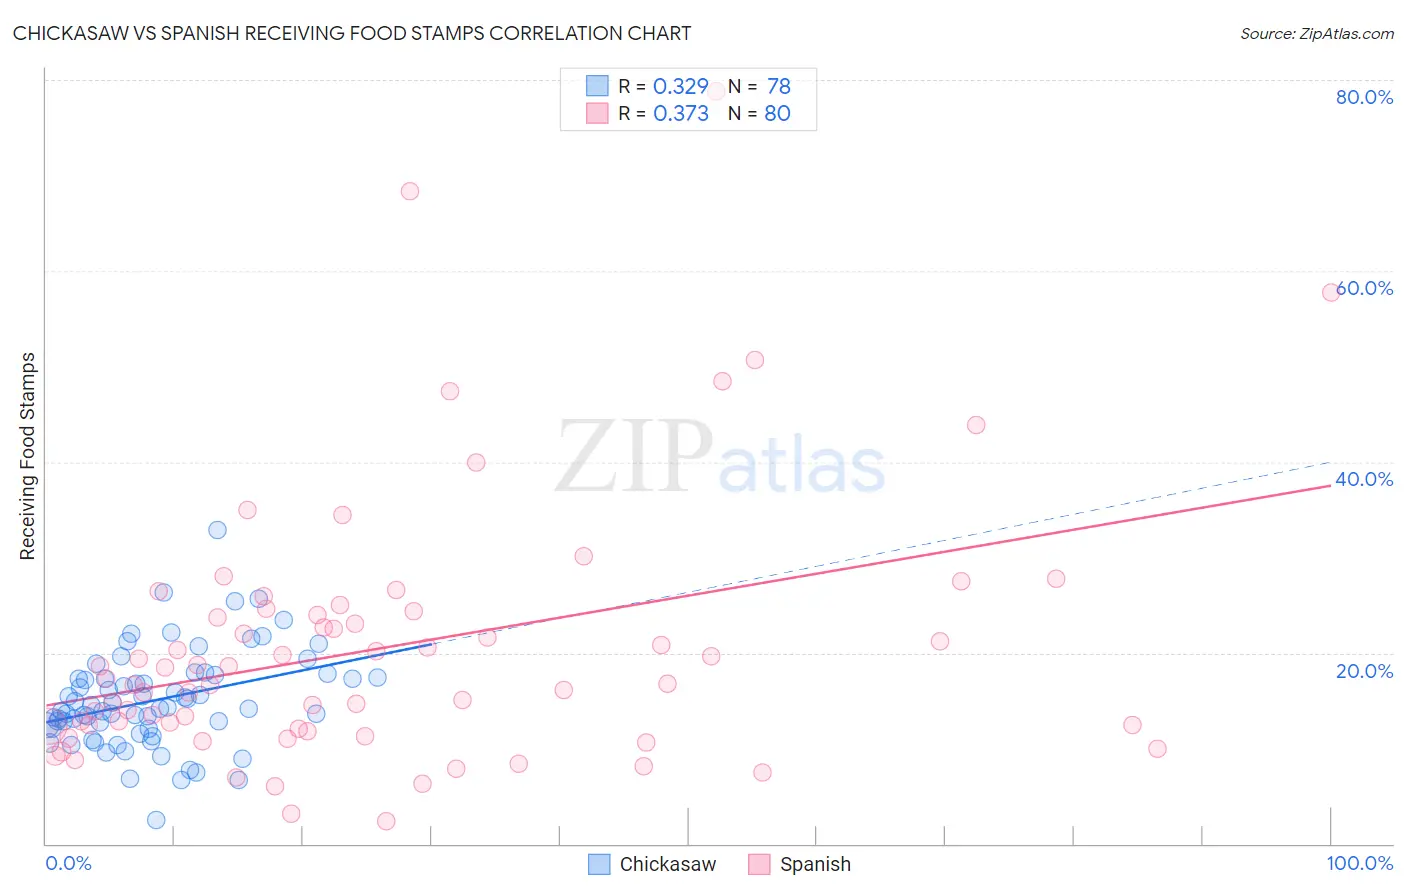
Chickasaw vs Spanish Receiving Food Stamps Correlation Chart
The statistical analysis conducted on geographies consisting of 147,564,346 people shows a mild positive correlation between the proportion of Chickasaw and percentage of population receiving government assistance and/or food stamps in the United States with a correlation coefficient (R) of 0.329 and weighted average of 13.1%. Similarly, the statistical analysis conducted on geographies consisting of 421,068,577 people shows a mild positive correlation between the proportion of Spanish and percentage of population receiving government assistance and/or food stamps in the United States with a correlation coefficient (R) of 0.373 and weighted average of 12.0%, a difference of 9.5%.
Receiving Food Stamps Correlation Summary
| Measurement | Chickasaw | Spanish |
| Minimum | 2.5% | 2.3% |
| Maximum | 32.8% | 78.8% |
| Range | 30.3% | 76.5% |
| Mean | 15.0% | 20.5% |
| Median | 14.2% | 17.0% |
| Interquartile 25% (IQ1) | 12.0% | 12.2% |
| Interquartile 75% (IQ3) | 17.4% | 24.1% |
| Interquartile Range (IQR) | 5.4% | 11.9% |
| Standard Deviation (Sample) | 5.1% | 13.8% |
| Standard Deviation (Population) | 5.0% | 13.7% |
Similar Demographics by Receiving Food Stamps
Demographics Similar to Chickasaw by Receiving Food Stamps
In terms of receiving food stamps, the demographic groups most similar to Chickasaw are Nigerian (13.1%, a difference of 0.050%), Panamanian (13.1%, a difference of 0.050%), Ottawa (13.1%, a difference of 0.070%), Puget Sound Salish (13.1%, a difference of 0.12%), and Immigrants from Nigeria (13.1%, a difference of 0.15%).
| Demographics | Rating | Rank | Receiving Food Stamps |
| Immigrants | Middle Africa | 5.4 /100 | #219 | Tragic 12.9% |
| Immigrants | Colombia | 5.3 /100 | #220 | Tragic 12.9% |
| Bermudans | 4.8 /100 | #221 | Tragic 13.0% |
| Immigrants | Immigrants | 4.4 /100 | #222 | Tragic 13.0% |
| Immigrants | Albania | 4.4 /100 | #223 | Tragic 13.0% |
| Immigrants | Armenia | 4.3 /100 | #224 | Tragic 13.0% |
| Fijians | 4.3 /100 | #225 | Tragic 13.0% |
| Chickasaw | 3.6 /100 | #226 | Tragic 13.1% |
| Nigerians | 3.5 /100 | #227 | Tragic 13.1% |
| Panamanians | 3.5 /100 | #228 | Tragic 13.1% |
| Ottawa | 3.5 /100 | #229 | Tragic 13.1% |
| Puget Sound Salish | 3.4 /100 | #230 | Tragic 13.1% |
| Immigrants | Nigeria | 3.4 /100 | #231 | Tragic 13.1% |
| Salvadorans | 2.7 /100 | #232 | Tragic 13.2% |
| Cherokee | 2.5 /100 | #233 | Tragic 13.2% |
Demographics Similar to Spanish by Receiving Food Stamps
In terms of receiving food stamps, the demographic groups most similar to Spanish are Immigrants from Iraq (12.0%, a difference of 0.040%), Albanian (12.0%, a difference of 0.22%), Spaniard (11.9%, a difference of 0.42%), Immigrants from Uganda (11.9%, a difference of 0.50%), and Sudanese (12.0%, a difference of 0.52%).
| Demographics | Rating | Rank | Receiving Food Stamps |
| Immigrants | Kenya | 46.4 /100 | #179 | Average 11.8% |
| Uruguayans | 44.8 /100 | #180 | Average 11.8% |
| South American Indians | 41.7 /100 | #181 | Average 11.9% |
| Immigrants | Morocco | 40.7 /100 | #182 | Average 11.9% |
| Immigrants | Uganda | 40.3 /100 | #183 | Average 11.9% |
| Spaniards | 39.8 /100 | #184 | Fair 11.9% |
| Immigrants | Iraq | 37.1 /100 | #185 | Fair 12.0% |
| Spanish | 36.9 /100 | #186 | Fair 12.0% |
| Albanians | 35.4 /100 | #187 | Fair 12.0% |
| Sudanese | 33.4 /100 | #188 | Fair 12.0% |
| Immigrants | Cameroon | 32.5 /100 | #189 | Fair 12.0% |
| Immigrants | Peru | 32.2 /100 | #190 | Fair 12.0% |
| Venezuelans | 32.1 /100 | #191 | Fair 12.0% |
| Samoans | 31.0 /100 | #192 | Fair 12.1% |
| Immigrants | Fiji | 27.8 /100 | #193 | Fair 12.1% |