American Receiving Food Stamps
COMPARE
American
Select to Compare
Receiving Food Stamps
American Receiving Food Stamps
12.2%
PUBLIC INCOME | FOOD STAMPS
26.7/ 100
METRIC RATING
195th/ 347
METRIC RANK
American Receiving Food Stamps Correlation Chart
The statistical analysis conducted on geographies consisting of 578,010,429 people shows a moderate positive correlation between the proportion of Americans and percentage of population receiving government assistance and/or food stamps in the United States with a correlation coefficient (R) of 0.484 and weighted average of 12.2%. On average, for every 1% (one percent) increase in Americans within a typical geography, there is an increase of 0.18% in percentage of population receiving government assistance and/or food stamps.
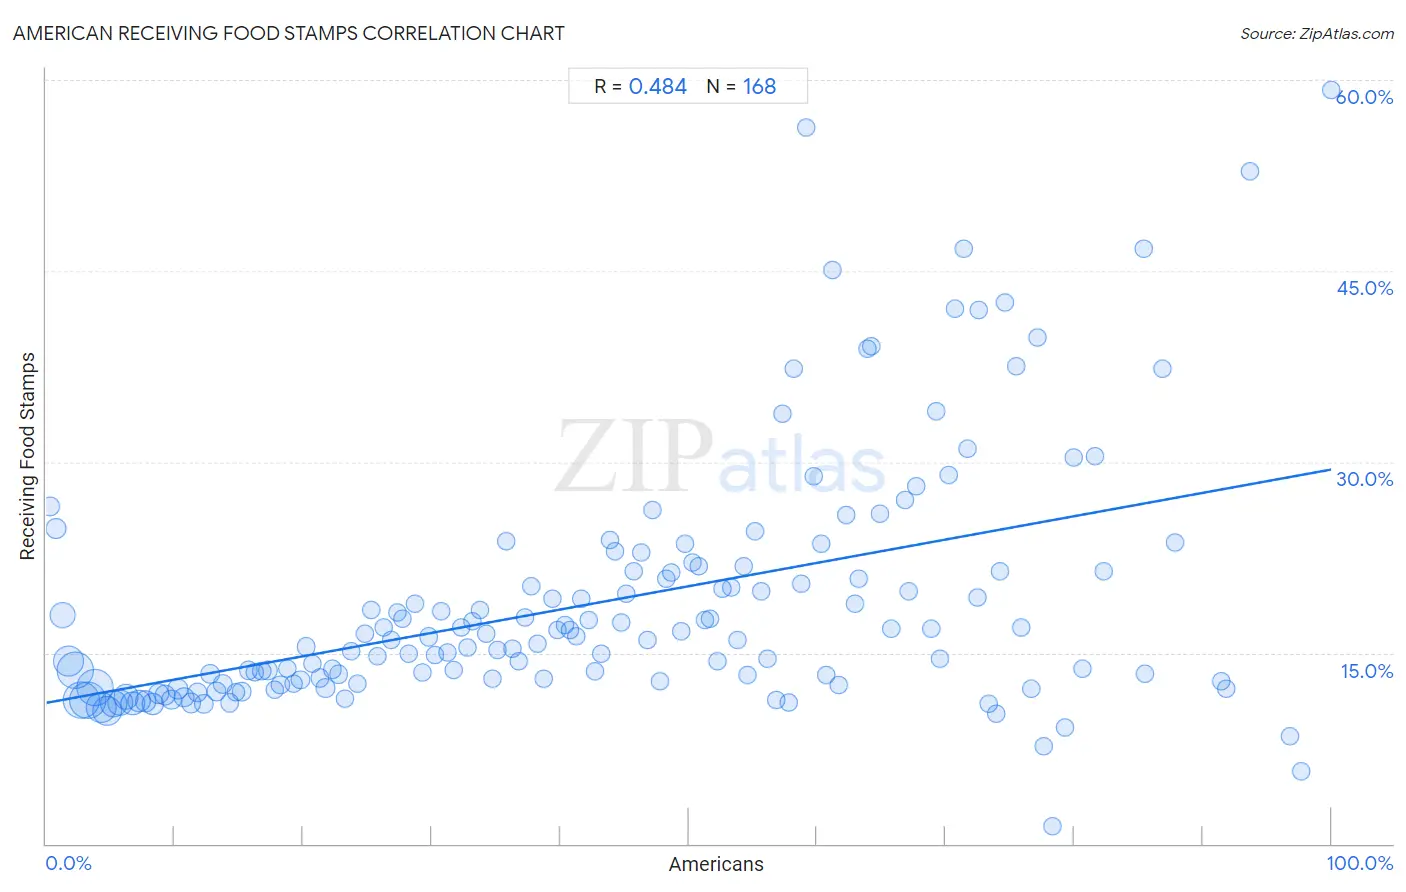
It is essential to understand that the correlation between the percentage of Americans and percentage of population receiving government assistance and/or food stamps does not imply a direct cause-and-effect relationship. It remains uncertain whether the presence of Americans influences an upward or downward trend in the level of percentage of population receiving government assistance and/or food stamps within an area, or if Americans simply ended up residing in those areas with higher or lower levels of percentage of population receiving government assistance and/or food stamps due to other factors.
Demographics Similar to Americans by Receiving Food Stamps
In terms of receiving food stamps, the demographic groups most similar to Americans are Iraqi (12.2%, a difference of 0.030%), Immigrants from Sudan (12.1%, a difference of 0.060%), Delaware (12.2%, a difference of 0.11%), Immigrants from Fiji (12.1%, a difference of 0.18%), and Immigrants from Costa Rica (12.2%, a difference of 0.24%).
| Demographics | Rating | Rank | Receiving Food Stamps |
| Sudanese | 33.4 /100 | #188 | Fair 12.0% |
| Immigrants from Cameroon | 32.5 /100 | #189 | Fair 12.0% |
| Immigrants from Peru | 32.2 /100 | #190 | Fair 12.0% |
| Venezuelans | 32.1 /100 | #191 | Fair 12.0% |
| Samoans | 31.0 /100 | #192 | Fair 12.1% |
| Immigrants from Fiji | 27.8 /100 | #193 | Fair 12.1% |
| Immigrants from Sudan | 27.1 /100 | #194 | Fair 12.1% |
| Americans | 26.7 /100 | #195 | Fair 12.2% |
| Iraqis | 26.6 /100 | #196 | Fair 12.2% |
| Delaware | 26.1 /100 | #197 | Fair 12.2% |
| Immigrants from Costa Rica | 25.4 /100 | #198 | Fair 12.2% |
| Portuguese | 25.1 /100 | #199 | Fair 12.2% |
| Sierra Leoneans | 23.6 /100 | #200 | Fair 12.2% |
| Ugandans | 22.5 /100 | #201 | Fair 12.2% |
| Immigrants from Venezuela | 20.1 /100 | #202 | Fair 12.3% |
American Receiving Food Stamps Correlation Summary
| Measurement | American Data | Receiving Food Stamps Data |
| Minimum | 0.34% | 1.4% |
| Maximum | 100.0% | 59.3% |
| Range | 99.7% | 57.9% |
| Mean | 42.9% | 18.9% |
| Median | 41.9% | 16.0% |
| Interquartile 25% (IQ1) | 21.0% | 12.6% |
| Interquartile 75% (IQ3) | 63.1% | 21.4% |
| Interquartile Range (IQR) | 42.1% | 8.8% |
| Standard Deviation (Sample) | 25.8% | 9.8% |
| Standard Deviation (Population) | 25.7% | 9.7% |
Correlation Details
| American Percentile | Sample Size | Receiving Food Stamps |
[ 0.0% - 0.5% ] 0.34% | 2,774,885 | 26.5% |
[ 0.5% - 1.0% ] 0.79% | 9,082,811 | 24.8% |
[ 1.0% - 1.5% ] 1.28% | 22,432,450 | 18.0% |
[ 1.5% - 2.0% ] 1.76% | 39,644,335 | 14.4% |
[ 2.0% - 2.5% ] 2.26% | 56,223,440 | 13.6% |
[ 2.5% - 3.0% ] 2.75% | 57,320,546 | 11.3% |
[ 3.0% - 3.5% ] 3.24% | 56,368,734 | 11.3% |
[ 3.5% - 4.0% ] 3.75% | 57,845,758 | 12.3% |
[ 4.0% - 4.5% ] 4.25% | 39,079,174 | 10.7% |
[ 4.5% - 5.0% ] 4.74% | 36,796,288 | 10.4% |
[ 5.0% - 5.5% ] 5.25% | 27,321,612 | 11.0% |
[ 5.5% - 6.0% ] 5.76% | 21,673,496 | 11.1% |
[ 6.0% - 6.5% ] 6.24% | 19,982,321 | 11.5% |
[ 6.5% - 7.0% ] 6.75% | 17,623,120 | 11.0% |
[ 7.0% - 7.5% ] 7.24% | 13,138,071 | 11.2% |
[ 7.5% - 8.0% ] 7.74% | 11,254,380 | 11.2% |
[ 8.0% - 8.5% ] 8.26% | 10,097,256 | 11.0% |
[ 8.5% - 9.0% ] 8.74% | 7,846,774 | 11.8% |
[ 9.0% - 9.5% ] 9.25% | 7,196,781 | 11.7% |
[ 9.5% - 10.0% ] 9.74% | 6,194,758 | 11.3% |
[ 10.0% - 10.5% ] 10.24% | 5,907,606 | 12.2% |
[ 10.5% - 11.0% ] 10.73% | 5,641,663 | 11.5% |
[ 11.0% - 11.5% ] 11.24% | 4,746,123 | 11.0% |
[ 11.5% - 12.0% ] 11.72% | 4,167,083 | 11.9% |
[ 12.0% - 12.5% ] 12.24% | 3,391,773 | 11.0% |
[ 12.5% - 13.0% ] 12.73% | 3,225,149 | 13.4% |
[ 13.0% - 13.5% ] 13.24% | 2,439,018 | 11.9% |
[ 13.5% - 14.0% ] 13.75% | 2,181,858 | 12.5% |
[ 14.0% - 14.5% ] 14.27% | 2,009,401 | 11.1% |
[ 14.5% - 15.0% ] 14.76% | 1,744,329 | 11.9% |
[ 15.0% - 15.5% ] 15.21% | 1,498,068 | 11.9% |
[ 15.5% - 16.0% ] 15.76% | 1,816,651 | 13.6% |
[ 16.0% - 16.5% ] 16.25% | 1,566,385 | 13.5% |
[ 16.5% - 17.0% ] 16.77% | 1,173,188 | 13.6% |
[ 17.0% - 17.5% ] 17.23% | 1,479,443 | 13.6% |
[ 17.5% - 18.0% ] 17.76% | 1,391,143 | 12.1% |
[ 18.0% - 18.5% ] 18.22% | 948,398 | 12.5% |
[ 18.5% - 19.0% ] 18.75% | 758,725 | 13.7% |
[ 19.0% - 19.5% ] 19.23% | 818,042 | 12.6% |
[ 19.5% - 20.0% ] 19.77% | 933,774 | 12.9% |
[ 20.0% - 20.5% ] 20.24% | 601,283 | 15.5% |
[ 20.5% - 21.0% ] 20.73% | 508,723 | 14.1% |
[ 21.0% - 21.5% ] 21.29% | 680,146 | 13.0% |
[ 21.5% - 22.0% ] 21.73% | 556,038 | 12.2% |
[ 22.0% - 22.5% ] 22.24% | 358,917 | 13.7% |
[ 22.5% - 23.0% ] 22.75% | 614,260 | 13.3% |
[ 23.0% - 23.5% ] 23.28% | 386,479 | 11.4% |
[ 23.5% - 24.0% ] 23.75% | 413,841 | 15.1% |
[ 24.0% - 24.5% ] 24.26% | 452,650 | 12.6% |
[ 24.5% - 25.0% ] 24.76% | 292,411 | 16.5% |
[ 25.0% - 25.5% ] 25.26% | 293,999 | 18.3% |
[ 25.5% - 26.0% ] 25.74% | 291,833 | 14.7% |
[ 26.0% - 26.5% ] 26.24% | 274,805 | 17.0% |
[ 26.5% - 27.0% ] 26.85% | 520,529 | 16.0% |
[ 27.0% - 27.5% ] 27.30% | 257,978 | 18.1% |
[ 27.5% - 28.0% ] 27.75% | 269,048 | 17.7% |
[ 28.0% - 28.5% ] 28.23% | 249,847 | 15.0% |
[ 28.5% - 29.0% ] 28.72% | 147,029 | 18.9% |
[ 29.0% - 29.5% ] 29.25% | 239,043 | 13.4% |
[ 29.5% - 30.0% ] 29.72% | 182,725 | 16.3% |
[ 30.0% - 30.5% ] 30.28% | 115,014 | 14.8% |
[ 30.5% - 31.0% ] 30.75% | 256,351 | 18.3% |
[ 31.0% - 31.5% ] 31.24% | 132,941 | 15.0% |
[ 31.5% - 32.0% ] 31.72% | 79,482 | 13.6% |
[ 32.0% - 32.5% ] 32.25% | 247,317 | 17.0% |
[ 32.5% - 33.0% ] 32.76% | 109,613 | 15.4% |
[ 33.0% - 33.5% ] 33.21% | 101,093 | 17.5% |
[ 33.5% - 34.0% ] 33.73% | 87,937 | 18.4% |
[ 34.0% - 34.5% ] 34.22% | 51,593 | 16.5% |
[ 34.5% - 35.0% ] 34.75% | 98,007 | 13.0% |
[ 35.0% - 35.5% ] 35.16% | 50,890 | 15.2% |
[ 35.5% - 36.0% ] 35.77% | 115,210 | 23.7% |
[ 36.0% - 36.5% ] 36.27% | 129,211 | 15.4% |
[ 36.5% - 37.0% ] 36.81% | 52,809 | 14.3% |
[ 37.0% - 37.5% ] 37.21% | 63,768 | 17.8% |
[ 37.5% - 38.0% ] 37.71% | 87,657 | 20.2% |
[ 38.0% - 38.5% ] 38.24% | 45,070 | 15.7% |
[ 38.5% - 39.0% ] 38.72% | 48,607 | 12.9% |
[ 39.0% - 39.5% ] 39.35% | 70,230 | 19.3% |
[ 39.5% - 40.0% ] 39.79% | 54,533 | 16.8% |
[ 40.0% - 40.5% ] 40.33% | 25,675 | 17.2% |
[ 40.5% - 41.0% ] 40.79% | 33,793 | 16.8% |
[ 41.0% - 41.5% ] 41.28% | 40,757 | 16.3% |
[ 41.5% - 42.0% ] 41.63% | 28,149 | 19.3% |
[ 42.0% - 42.5% ] 42.26% | 26,567 | 17.6% |
[ 42.5% - 43.0% ] 42.71% | 19,822 | 13.6% |
[ 43.0% - 43.5% ] 43.22% | 52,820 | 14.9% |
[ 43.5% - 44.0% ] 43.86% | 39,833 | 23.9% |
[ 44.0% - 44.5% ] 44.26% | 16,668 | 23.0% |
[ 44.5% - 45.0% ] 44.75% | 34,017 | 17.4% |
[ 45.0% - 45.5% ] 45.18% | 13,352 | 19.7% |
[ 45.5% - 46.0% ] 45.74% | 23,809 | 21.5% |
[ 46.0% - 46.5% ] 46.33% | 12,826 | 22.9% |
[ 46.5% - 47.0% ] 46.79% | 4,138 | 16.0% |
[ 47.0% - 47.5% ] 47.15% | 30,971 | 26.2% |
[ 47.5% - 48.0% ] 47.75% | 10,351 | 12.8% |
[ 48.0% - 48.5% ] 48.28% | 24,206 | 20.9% |
[ 48.5% - 49.0% ] 48.67% | 8,526 | 21.3% |
[ 49.0% - 49.5% ] 49.37% | 16,966 | 16.7% |
[ 49.5% - 50.0% ] 49.73% | 18,247 | 23.5% |
[ 50.0% - 50.5% ] 50.31% | 11,792 | 22.1% |
[ 50.5% - 51.0% ] 50.81% | 5,410 | 21.8% |
[ 51.0% - 51.5% ] 51.30% | 6,951 | 17.6% |
[ 51.5% - 52.0% ] 51.66% | 15,283 | 17.7% |
[ 52.0% - 52.5% ] 52.21% | 13,305 | 14.4% |
[ 52.5% - 53.0% ] 52.62% | 5,466 | 20.1% |
[ 53.0% - 53.5% ] 53.29% | 16,208 | 20.1% |
[ 53.5% - 54.0% ] 53.79% | 2,346 | 16.0% |
[ 54.0% - 54.5% ] 54.30% | 2,556 | 21.8% |
[ 54.5% - 55.0% ] 54.62% | 10,753 | 13.3% |
[ 55.0% - 55.5% ] 55.18% | 2,849 | 24.6% |
[ 55.5% - 56.0% ] 55.66% | 4,723 | 19.8% |
[ 56.0% - 56.5% ] 56.12% | 9,129 | 14.6% |
[ 56.5% - 57.0% ] 56.80% | 16,492 | 11.3% |
[ 57.0% - 57.5% ] 57.27% | 1,397 | 33.8% |
[ 57.5% - 58.0% ] 57.74% | 1,001 | 11.1% |
[ 58.0% - 58.5% ] 58.17% | 2,037 | 37.3% |
[ 58.5% - 59.0% ] 58.77% | 11,088 | 20.5% |
[ 59.0% - 59.5% ] 59.15% | 749 | 56.3% |
[ 59.5% - 60.0% ] 59.70% | 2,896 | 28.8% |
[ 60.0% - 60.5% ] 60.26% | 5,690 | 23.6% |
[ 60.5% - 61.0% ] 60.74% | 2,769 | 13.3% |
[ 61.0% - 61.5% ] 61.16% | 986 | 45.1% |
[ 61.5% - 62.0% ] 61.69% | 6,560 | 12.5% |
[ 62.0% - 62.5% ] 62.24% | 3,157 | 25.8% |
[ 62.5% - 63.0% ] 62.95% | 2,756 | 18.9% |
[ 63.0% - 63.5% ] 63.26% | 5,228 | 20.8% |
[ 63.5% - 64.0% ] 63.87% | 2,336 | 38.9% |
[ 64.0% - 64.5% ] 64.17% | 321 | 39.1% |
[ 64.5% - 65.0% ] 64.87% | 2,189 | 26.0% |
[ 65.5% - 66.0% ] 65.80% | 807 | 16.9% |
[ 66.5% - 67.0% ] 66.80% | 1,961 | 27.0% |
[ 67.0% - 67.5% ] 67.14% | 4,123 | 19.9% |
[ 67.5% - 68.0% ] 67.66% | 2,455 | 28.1% |
[ 68.5% - 69.0% ] 68.82% | 170 | 16.9% |
[ 69.0% - 69.5% ] 69.23% | 208 | 34.0% |
[ 69.5% - 70.0% ] 69.54% | 2,718 | 14.5% |
[ 70.0% - 70.5% ] 70.20% | 302 | 29.0% |
[ 70.5% - 71.0% ] 70.69% | 836 | 42.1% |
[ 71.0% - 71.5% ] 71.36% | 597 | 46.7% |
[ 71.5% - 72.0% ] 71.71% | 608 | 31.0% |
[ 72.0% - 72.5% ] 72.44% | 2,449 | 19.4% |
[ 72.5% - 73.0% ] 72.55% | 51 | 41.9% |
[ 73.0% - 73.5% ] 73.33% | 735 | 11.0% |
[ 73.5% - 74.0% ] 73.91% | 1,510 | 10.2% |
[ 74.0% - 74.5% ] 74.25% | 730 | 21.4% |
[ 74.5% - 75.0% ] 74.56% | 1,030 | 42.5% |
[ 75.0% - 75.5% ] 75.44% | 114 | 37.5% |
[ 75.5% - 76.0% ] 75.85% | 1,267 | 17.0% |
[ 76.5% - 77.0% ] 76.68% | 922 | 12.2% |
[ 77.0% - 77.5% ] 77.19% | 583 | 39.8% |
[ 77.5% - 78.0% ] 77.62% | 478 | 7.7% |
[ 78.0% - 78.5% ] 78.28% | 640 | 1.4% |
[ 79.0% - 79.5% ] 79.31% | 1,020 | 9.1% |
[ 80.0% - 80.5% ] 80.00% | 50 | 30.3% |
[ 80.5% - 81.0% ] 80.69% | 554 | 13.7% |
[ 81.5% - 82.0% ] 81.60% | 212 | 30.4% |
[ 82.0% - 82.5% ] 82.27% | 141 | 21.4% |
[ 85.0% - 85.5% ] 85.42% | 48 | 46.7% |
[ 85.5% - 86.0% ] 85.51% | 690 | 13.4% |
[ 86.5% - 87.0% ] 86.84% | 76 | 37.3% |
[ 87.5% - 88.0% ] 87.84% | 74 | 23.7% |
[ 91.0% - 91.5% ] 91.48% | 493 | 12.8% |
[ 91.5% - 92.0% ] 91.88% | 517 | 12.2% |
[ 93.5% - 94.0% ] 93.64% | 110 | 52.8% |
[ 96.5% - 97.0% ] 96.82% | 220 | 8.4% |
[ 97.5% - 98.0% ] 97.64% | 339 | 5.7% |
[ 99.5% - 100.0% ] 100.00% | 948 | 59.3% |