Chickasaw vs Chinese Receiving Food Stamps
COMPARE
Chickasaw
Chinese
Receiving Food Stamps
Receiving Food Stamps Comparison
Chickasaw
Chinese
13.1%
RECEIVING FOOD STAMPS
3.6/ 100
METRIC RATING
226th/ 347
METRIC RANK
9.8%
RECEIVING FOOD STAMPS
99.2/ 100
METRIC RATING
63rd/ 347
METRIC RANK
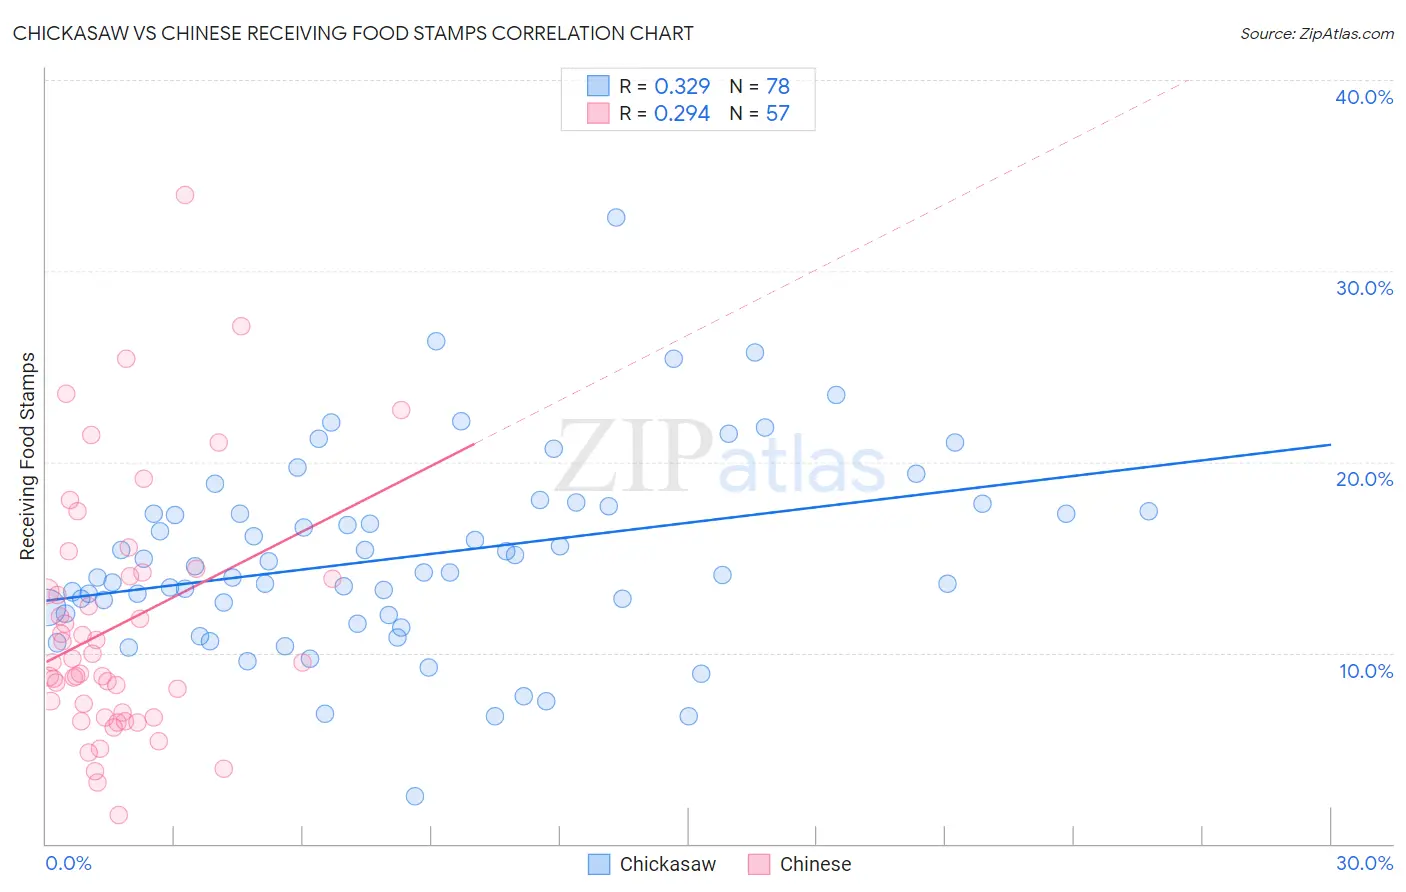
Chickasaw vs Chinese Receiving Food Stamps Correlation Chart
The statistical analysis conducted on geographies consisting of 147,564,346 people shows a mild positive correlation between the proportion of Chickasaw and percentage of population receiving government assistance and/or food stamps in the United States with a correlation coefficient (R) of 0.329 and weighted average of 13.1%. Similarly, the statistical analysis conducted on geographies consisting of 64,766,872 people shows a weak positive correlation between the proportion of Chinese and percentage of population receiving government assistance and/or food stamps in the United States with a correlation coefficient (R) of 0.294 and weighted average of 9.8%, a difference of 34.0%.
Receiving Food Stamps Correlation Summary
| Measurement | Chickasaw | Chinese |
| Minimum | 2.5% | 1.5% |
| Maximum | 32.8% | 34.0% |
| Range | 30.3% | 32.5% |
| Mean | 15.0% | 11.5% |
| Median | 14.2% | 9.5% |
| Interquartile 25% (IQ1) | 12.0% | 6.8% |
| Interquartile 75% (IQ3) | 17.4% | 14.1% |
| Interquartile Range (IQR) | 5.4% | 7.3% |
| Standard Deviation (Sample) | 5.1% | 6.5% |
| Standard Deviation (Population) | 5.0% | 6.4% |
Similar Demographics by Receiving Food Stamps
Demographics Similar to Chickasaw by Receiving Food Stamps
In terms of receiving food stamps, the demographic groups most similar to Chickasaw are Nigerian (13.1%, a difference of 0.050%), Panamanian (13.1%, a difference of 0.050%), Ottawa (13.1%, a difference of 0.070%), Puget Sound Salish (13.1%, a difference of 0.12%), and Immigrants from Nigeria (13.1%, a difference of 0.15%).
| Demographics | Rating | Rank | Receiving Food Stamps |
| Immigrants | Middle Africa | 5.4 /100 | #219 | Tragic 12.9% |
| Immigrants | Colombia | 5.3 /100 | #220 | Tragic 12.9% |
| Bermudans | 4.8 /100 | #221 | Tragic 13.0% |
| Immigrants | Immigrants | 4.4 /100 | #222 | Tragic 13.0% |
| Immigrants | Albania | 4.4 /100 | #223 | Tragic 13.0% |
| Immigrants | Armenia | 4.3 /100 | #224 | Tragic 13.0% |
| Fijians | 4.3 /100 | #225 | Tragic 13.0% |
| Chickasaw | 3.6 /100 | #226 | Tragic 13.1% |
| Nigerians | 3.5 /100 | #227 | Tragic 13.1% |
| Panamanians | 3.5 /100 | #228 | Tragic 13.1% |
| Ottawa | 3.5 /100 | #229 | Tragic 13.1% |
| Puget Sound Salish | 3.4 /100 | #230 | Tragic 13.1% |
| Immigrants | Nigeria | 3.4 /100 | #231 | Tragic 13.1% |
| Salvadorans | 2.7 /100 | #232 | Tragic 13.2% |
| Cherokee | 2.5 /100 | #233 | Tragic 13.2% |
Demographics Similar to Chinese by Receiving Food Stamps
In terms of receiving food stamps, the demographic groups most similar to Chinese are Immigrants from Bulgaria (9.8%, a difference of 0.030%), Immigrants from North America (9.8%, a difference of 0.090%), English (9.8%, a difference of 0.11%), German (9.7%, a difference of 0.25%), and Immigrants from Turkey (9.8%, a difference of 0.26%).
| Demographics | Rating | Rank | Receiving Food Stamps |
| Immigrants | Canada | 99.3 /100 | #56 | Exceptional 9.7% |
| Greeks | 99.3 /100 | #57 | Exceptional 9.7% |
| Scandinavians | 99.2 /100 | #58 | Exceptional 9.7% |
| British | 99.2 /100 | #59 | Exceptional 9.7% |
| Germans | 99.2 /100 | #60 | Exceptional 9.7% |
| English | 99.2 /100 | #61 | Exceptional 9.8% |
| Immigrants | Bulgaria | 99.2 /100 | #62 | Exceptional 9.8% |
| Chinese | 99.2 /100 | #63 | Exceptional 9.8% |
| Immigrants | North America | 99.2 /100 | #64 | Exceptional 9.8% |
| Immigrants | Turkey | 99.1 /100 | #65 | Exceptional 9.8% |
| Slovenes | 99.1 /100 | #66 | Exceptional 9.8% |
| Immigrants | Indonesia | 99.0 /100 | #67 | Exceptional 9.8% |
| Northern Europeans | 99.0 /100 | #68 | Exceptional 9.8% |
| Italians | 99.0 /100 | #69 | Exceptional 9.9% |
| Immigrants | Serbia | 99.0 /100 | #70 | Exceptional 9.9% |