Zip Codes with the Highest Percentage of Population Employed in Arts, Media & Entertainment in Portland, OR

RELATED REPORTS & OPTIONS

Arts, Media & Entertainment
Population
Families and Households
Female Fertility
Female Fertility (Unmarried)
Race (Community Size)
Race (Percentage)
Ancestry (Community Size)
AfghanAfricanAlaska NativeAlaskan AthabascanAlbanianAleutAlsatianAmericanApacheArabArgentineanArmenianAustralianAustrianBahamianBangladeshiBasqueBelgianBelizeanBhutaneseBlackfeetBolivianBrazilianBritishBritish West IndianBulgarianBurmeseCajunCambodianCanadianCelticCentral AmericanCentral American IndianCherokeeCheyenneChickasawChileanChineseChippewaChoctawColombianColvilleCosta RicanCreeCreekCroatianCubanCzechCzechoslovakianDanishDelawareDominicanDutchEastern EuropeanEcuadorianEgyptianEnglishEstonianEthiopianEuropeanFijianFilipinoFinnishFrenchFrench American IndianFrench CanadianGermanGerman RussianGhanaianGreekGuamanian / ChamorroGuatemalanGuyaneseHaitianHonduranHopiHungarianIcelanderIndian (Asian)IndonesianInupiatIranianIraqiIrishIroquoisIsraeliItalianJamaicanJapaneseJordanianKenyanKoreanLaotianLatvianLebaneseLiberianLithuanianLumbeeLuxembourgerMacedonianMalaysianMalteseMarshalleseMexicanMexican American IndianMongolianMoroccanNative HawaiianNavajoNepaleseNew ZealanderNicaraguanNigerianNorthern EuropeanNorwegianOkinawanOsagePaiutePakistaniPalestinianPanamanianParaguayanPennsylvania GermanPeruvianPimaPolishPortuguesePotawatomiPuebloPuerto RicanPuget Sound SalishRomanianRussianSalvadoranSamoanScandinavianScotch-IrishScottishSeminoleSenegaleseSerbianShoshoneSierra LeoneanSiouxSlavicSlovakSloveneSomaliSouth AfricanSouth AmericanSouth American IndianSoviet UnionSpaniardSpanishSpanish AmericanSpanish American IndianSri LankanSubsaharan AfricanSwedishSwissSyrianThaiTlingit-HaidaTonganTrinidadian and TobagonianTsimshianTurkishUgandanUkrainianUruguayanUteVenezuelanVietnameseWelshWest IndianYakamaYaquiYugoslavianYup'ik
Ancestry (Percentage)
AfghanAfricanAlaska NativeAlaskan AthabascanAlbanianAleutAlsatianAmericanApacheArabArgentineanArmenianAustralianAustrianBahamianBangladeshiBasqueBelgianBelizeanBhutaneseBlackfeetBolivianBrazilianBritishBritish West IndianBulgarianBurmeseCajunCambodianCanadianCelticCentral AmericanCentral American IndianCherokeeCheyenneChickasawChileanChineseChippewaChoctawColombianColvilleCosta RicanCreeCreekCroatianCubanCzechCzechoslovakianDanishDelawareDominicanDutchEastern EuropeanEcuadorianEgyptianEnglishEstonianEthiopianEuropeanFijianFilipinoFinnishFrenchFrench American IndianFrench CanadianGermanGerman RussianGhanaianGreekGuamanian / ChamorroGuatemalanGuyaneseHaitianHonduranHopiHungarianIcelanderIndian (Asian)IndonesianInupiatIranianIraqiIrishIroquoisIsraeliItalianJamaicanJapaneseJordanianKenyanKoreanLaotianLatvianLebaneseLiberianLithuanianLumbeeLuxembourgerMacedonianMalaysianMalteseMarshalleseMexicanMexican American IndianMongolianMoroccanNative HawaiianNavajoNepaleseNew ZealanderNicaraguanNigerianNorthern EuropeanNorwegianOkinawanOsagePaiutePakistaniPalestinianPanamanianParaguayanPennsylvania GermanPeruvianPimaPolishPortuguesePotawatomiPuebloPuerto RicanPuget Sound SalishRomanianRussianSalvadoranSamoanScandinavianScotch-IrishScottishSeminoleSenegaleseSerbianShoshoneSierra LeoneanSiouxSlavicSlovakSloveneSomaliSouth AfricanSouth AmericanSouth American IndianSoviet UnionSpaniardSpanishSpanish AmericanSpanish American IndianSri LankanSubsaharan AfricanSwedishSwissSyrianThaiTlingit-HaidaTonganTrinidadian and TobagonianTsimshianTurkishUgandanUkrainianUruguayanUteVenezuelanVietnameseWelshWest IndianYakamaYaquiYugoslavianYup'ik
Immigrant Origin (Total)
AfghanistanAfricaArgentinaArmeniaAsiaAustraliaAustriaBahamasBangladeshBarbadosBelarusBelgiumBelizeBosnia and HerzegovinaBrazilBulgariaBurma / MyanmarCambodiaCameroonCanadaCaribbeanCentral AmericaChileChinaColombiaCongoCosta RicaCroatiaCubaCzechoslovakiaDenmarkDominican RepublicEastern AfricaEastern AsiaEastern EuropeEcuadorEgyptEl SalvadorEnglandEritreaEthiopiaEuropeFijiFranceGermanyGhanaGreeceGuatemalaHaitiHondurasHong KongHungaryIndiaIndonesiaIranIraqIrelandIsraelItalyJamaicaJapanJordanKazakhstanKenyaKoreaKuwaitLaosLatin AmericaLatviaLebanonLiberiaLithuaniaMalaysiaMexicoMicronesiaMiddle AfricaMoldovaMoroccoNepalNetherlandsNicaraguaNigeriaNorth MacedoniaNorthern AfricaNorthern EuropeNorwayOceaniaPakistanPanamaPeruPhilippinesPolandPortugalRomaniaRussiaSaudi ArabiaScotlandSerbiaSingaporeSomaliaSouth AfricaSouth AmericaSouth Central AsiaSouth Eastern AsiaSouthern EuropeSpainSri LankaSudanSwedenSwitzerlandSyriaTaiwanThailandTrinidad and TobagoTurkeyUgandaUkraineUruguayUzbekistanVenezuelaVietnamWestern AfricaWestern AsiaWestern EuropeYemen
Immigrant Origin (Percentage)
AfghanistanAfricaArgentinaArmeniaAsiaAustraliaAustriaBahamasBangladeshBarbadosBelarusBelgiumBelizeBosnia and HerzegovinaBrazilBulgariaBurma / MyanmarCambodiaCameroonCanadaCaribbeanCentral AmericaChileChinaColombiaCongoCosta RicaCroatiaCubaCzechoslovakiaDenmarkDominican RepublicEastern AfricaEastern AsiaEastern EuropeEcuadorEgyptEl SalvadorEnglandEritreaEthiopiaEuropeFijiFranceGermanyGhanaGreeceGuatemalaHaitiHondurasHong KongHungaryIndiaIndonesiaIranIraqIrelandIsraelItalyJamaicaJapanJordanKazakhstanKenyaKoreaKuwaitLaosLatin AmericaLatviaLebanonLiberiaLithuaniaMalaysiaMexicoMicronesiaMiddle AfricaMoldovaMoroccoNepalNetherlandsNicaraguaNigeriaNorth MacedoniaNorthern AfricaNorthern EuropeNorwayOceaniaPakistanPanamaPeruPhilippinesPolandPortugalRomaniaRussiaSaudi ArabiaScotlandSerbiaSingaporeSomaliaSouth AfricaSouth AmericaSouth Central AsiaSouth Eastern AsiaSouthern EuropeSpainSri LankaSudanSwedenSwitzerlandSyriaTaiwanThailandTrinidad and TobagoTurkeyUgandaUkraineUruguayUzbekistanVenezuelaVietnamWestern AfricaWestern AsiaWestern EuropeYemen
Income
Income (Families)
Income (Households)
Poverty
Poverty (Families)
Unemployment
Employment Occupations
Employment Industries
Employer Class
Commute Time
Commute Means
School Enrollment
Education by Degree Field
Occupancy
Finances
Physical Characteristics
Portland
Compare Zip Codes
Comparison Subject

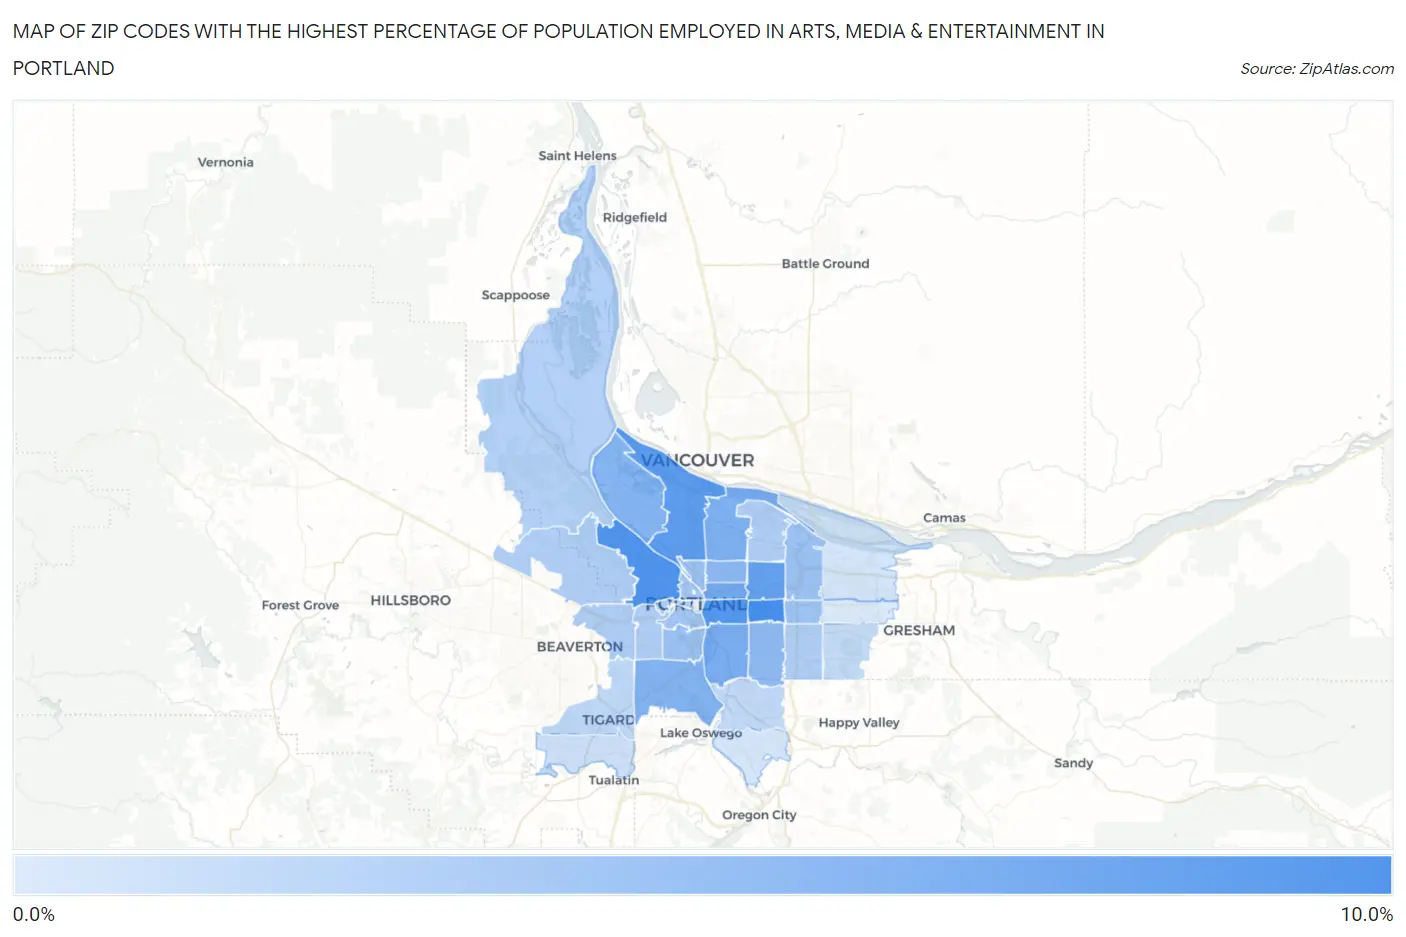
Map of Zip Codes with the Highest Percentage of Population Employed in Arts, Media & Entertainment in Portland

0.0%
10.0%
Zip Codes with the Highest Percentage of Population Employed in Arts, Media & Entertainment in Portland Map

Zip Codes with the Highest Percentage of Population Employed in Arts, Media & Entertainment in Portland, OR

Zip Code % Employed vs State vs National
1.972158.7%2.5%(+6.21)#42.1%(+6.66)#472
2.972108.3%2.5%(+5.78)#62.1%(+6.23)#519
3.972148.0%2.5%(+5.54)#92.1%(+5.99)#546
4.972177.5%2.5%(+4.96)#102.1%(+5.41)#650
5.972137.2%2.5%(+4.68)#112.1%(+5.13)#712
6.972326.5%2.5%(+3.98)#162.1%(+4.43)#879
7.972026.1%2.5%(+3.59)#182.1%(+4.04)#1,003
8.972115.9%2.5%(+3.37)#202.1%(+3.82)#1,088
9.972195.7%2.5%(+3.15)#222.1%(+3.60)#1,173
10.972035.5%2.5%(+3.01)#232.1%(+3.46)#1,236
11.972125.2%2.5%(+2.66)#252.1%(+3.11)#1,415
12.972065.1%2.5%(+2.55)#262.1%(+3.00)#1,469
13.972394.4%2.5%(+1.89)#332.1%(+2.34)#1,939
14.972204.3%2.5%(+1.78)#352.1%(+2.23)#2,049
15.972274.3%2.5%(+1.76)#362.1%(+2.21)#2,073
16.972164.2%2.5%(+1.67)#372.1%(+2.12)#2,158
17.972014.0%2.5%(+1.51)#392.1%(+1.96)#2,350
18.972094.0%2.5%(+1.46)#412.1%(+1.91)#2,395
19.972183.4%2.5%(+0.912)#502.1%(+1.36)#3,186
20.972213.4%2.5%(+0.910)#512.1%(+1.36)#3,193
21.972293.4%2.5%(+0.906)#522.1%(+1.36)#3,202
22.972663.4%2.5%(+0.867)#552.1%(+1.32)#3,279
23.972253.4%2.5%(+0.865)#562.1%(+1.31)#3,283
24.972313.2%2.5%(+0.660)#642.1%(+1.11)#3,688
25.972053.1%2.5%(+0.619)#652.1%(+1.07)#3,775
26.972232.6%2.5%(+0.041)#912.1%(+0.491)#5,394
27.972222.5%2.5%(-0.029)#982.1%(+0.421)#5,615
28.972362.4%2.5%(-0.141)#1032.1%(+0.310)#6,052
29.972241.9%2.5%(-0.593)#1302.1%(-0.143)#8,273
30.972301.6%2.5%(-0.947)#1512.1%(-0.497)#10,553
31.972671.5%2.5%(-1.04)#1572.1%(-0.589)#11,168
32.972331.1%2.5%(-1.40)#1972.1%(-0.951)#13,914

Common Questions

What are the Top 10 Zip Codes with the Highest Percentage of Population Employed in Arts, Media & Entertainment in Portland, OR?
Top 10 Zip Codes with the Highest Percentage of Population Employed in Arts, Media & Entertainment in Portland, OR are:
#1
8.7%
#2
8.3%
#3
8.0%
#4
7.5%
#5
7.2%
#6
6.5%
#7
6.1%
#8
5.9%
#9
5.7%
#10
5.5%
What zip code has the Highest Percentage of Population Employed in Arts, Media & Entertainment in Portland, OR?
97215 has the Highest Percentage of Population Employed in Arts, Media & Entertainment in Portland, OR with 8.7%.
What is the Percentage of Population Employed in Arts, Media & Entertainment in Portland, OR?
Percentage of Population Employed in Arts, Media & Entertainment in Portland is 5.1%.
What is the Percentage of Population Employed in Arts, Media & Entertainment in Oregon?
Percentage of Population Employed in Arts, Media & Entertainment in Oregon is 2.5%.
What is the Percentage of Population Employed in Arts, Media & Entertainment in the United States?
Percentage of Population Employed in Arts, Media & Entertainment in the United States is 2.1%.