Zip Codes with the Highest Percentage of Population with a Degree in Psychology in North Dakota
RELATED REPORTS & OPTIONS
Psychology
North Dakota
Compare Zip Codes
Map of Zip Codes with the Highest Percentage of Population with a Degree in Psychology in North Dakota
0.0%
40.0%
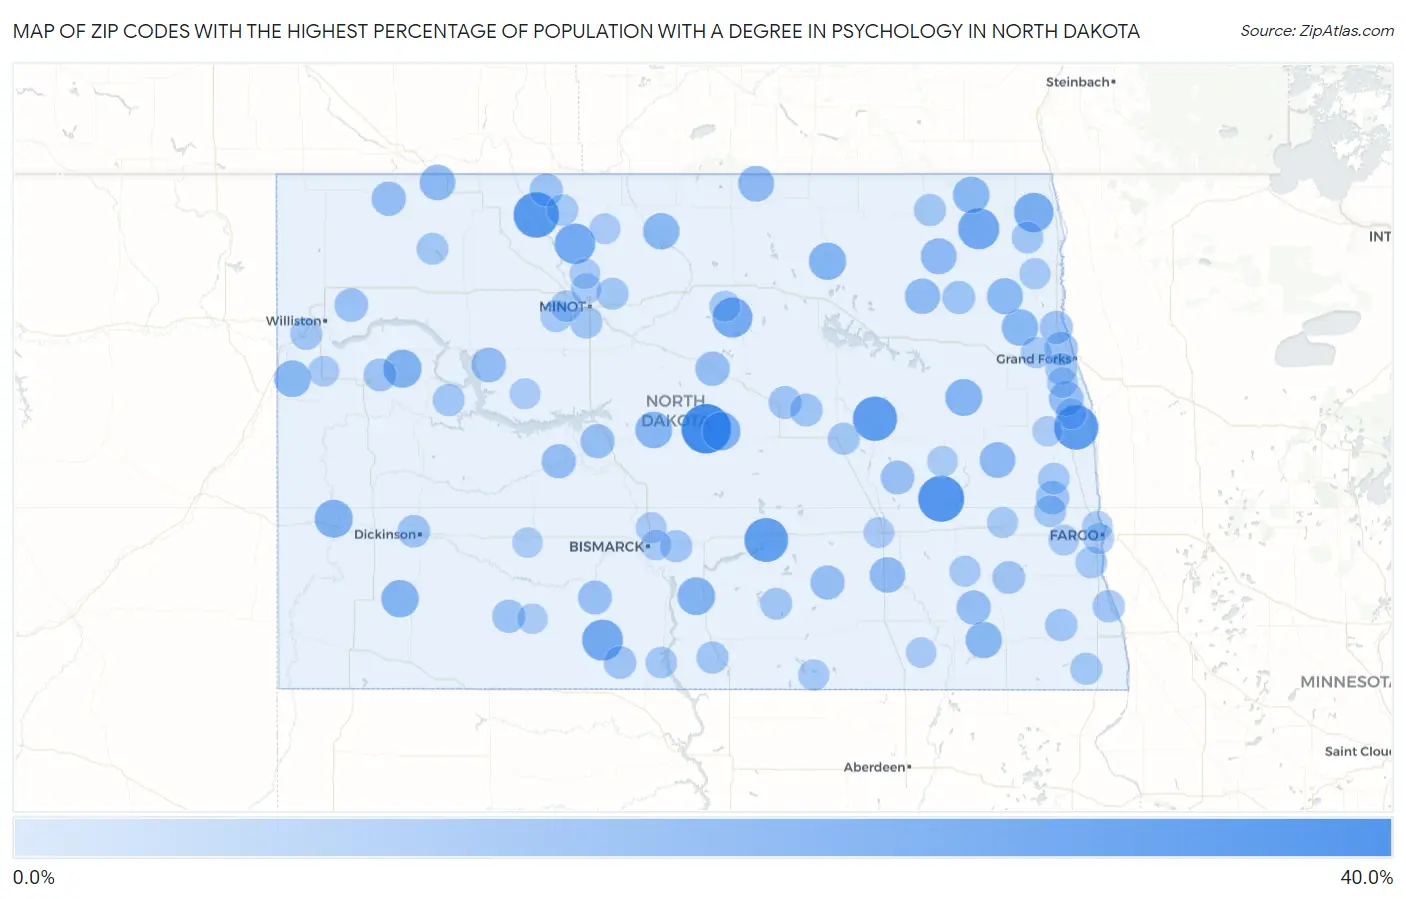
Zip Codes with the Highest Percentage of Population with a Degree in Psychology in North Dakota
| Zip Code | % Graduates | vs State | vs National | |
| 1. | 58430 | 33.3% | 3.5% (+29.8)#1 | 5.1% (+28.3)#250 |
| 2. | 58479 | 27.8% | 3.5% (+24.2)#2 | 5.1% (+22.7)#340 |
| 3. | 58787 | 26.7% | 3.5% (+23.1)#3 | 5.1% (+21.6)#382 |
| 4. | 58445 | 25.0% | 3.5% (+21.5)#4 | 5.1% (+19.9)#432 |
| 5. | 58223 | 25.0% | 3.5% (+21.5)#5 | 5.1% (+19.9)#435 |
| 6. | 58428 | 24.1% | 3.5% (+20.5)#6 | 5.1% (+19.0)#457 |
| 7. | 58262 | 20.0% | 3.5% (+16.5)#7 | 5.1% (+14.9)#664 |
| 8. | 58569 | 19.6% | 3.5% (+16.0)#8 | 5.1% (+14.5)#686 |
| 9. | 58750 | 19.0% | 3.5% (+15.4)#9 | 5.1% (+13.9)#729 |
| 10. | 58313 | 18.2% | 3.5% (+14.6)#10 | 5.1% (+13.1)#791 |
| 11. | 58238 | 17.4% | 3.5% (+13.9)#11 | 5.1% (+12.3)#863 |
| 12. | 58444 | 15.6% | 3.5% (+12.1)#12 | 5.1% (+10.6)#1,054 |
| 13. | 58847 | 15.2% | 3.5% (+11.6)#13 | 5.1% (+10.1)#1,109 |
| 14. | 58645 | 15.1% | 3.5% (+11.5)#14 | 5.1% (+10.0)#1,124 |
| 15. | 58544 | 14.5% | 3.5% (+11.0)#15 | 5.1% (+9.47)#1,198 |
| 16. | 58647 | 14.2% | 3.5% (+10.6)#16 | 5.1% (+9.11)#1,258 |
| 17. | 58324 | 13.9% | 3.5% (+10.4)#17 | 5.1% (+8.84)#1,295 |
| 18. | 58212 | 13.4% | 3.5% (+9.86)#18 | 5.1% (+8.34)#1,398 |
| 19. | 58559 | 13.1% | 3.5% (+9.60)#19 | 5.1% (+8.08)#1,451 |
| 20. | 58838 | 13.0% | 3.5% (+9.51)#20 | 5.1% (+7.99)#1,472 |
| 21. | 58282 | 12.8% | 3.5% (+9.25)#21 | 5.1% (+7.73)#1,523 |
| 22. | 58235 | 12.6% | 3.5% (+9.11)#22 | 5.1% (+7.59)#1,559 |
| 23. | 58748 | 12.5% | 3.5% (+8.97)#23 | 5.1% (+7.45)#1,604 |
| 24. | 58069 | 12.5% | 3.5% (+8.97)#24 | 5.1% (+7.45)#1,605 |
| 25. | 58273 | 12.0% | 3.5% (+8.47)#25 | 5.1% (+6.95)#1,730 |
| 26. | 58229 | 11.8% | 3.5% (+8.23)#26 | 5.1% (+6.71)#1,805 |
| 27. | 58369 | 11.7% | 3.5% (+8.13)#27 | 5.1% (+6.62)#1,829 |
| 28. | 58046 | 11.5% | 3.5% (+7.93)#28 | 5.1% (+6.41)#1,891 |
| 29. | 58772 | 11.3% | 3.5% (+7.79)#29 | 5.1% (+6.27)#1,940 |
| 30. | 58472 | 11.1% | 3.5% (+7.58)#30 | 5.1% (+6.06)#2,021 |
| 31. | 58345 | 10.9% | 3.5% (+7.34)#31 | 5.1% (+5.82)#2,114 |
| 32. | 58770 | 9.8% | 3.5% (+6.27)#32 | 5.1% (+4.75)#2,598 |
| 33. | 58275 | 9.7% | 3.5% (+6.21)#33 | 5.1% (+4.69)#2,642 |
| 34. | 58710 | 9.4% | 3.5% (+5.90)#34 | 5.1% (+4.38)#2,826 |
| 35. | 58765 | 9.2% | 3.5% (+5.71)#35 | 5.1% (+4.19)#2,958 |
| 36. | 58033 | 9.2% | 3.5% (+5.70)#36 | 5.1% (+4.18)#2,968 |
| 37. | 58545 | 9.1% | 3.5% (+5.57)#37 | 5.1% (+4.05)#3,043 |
| 38. | 58576 | 9.0% | 3.5% (+5.49)#38 | 5.1% (+3.97)#3,114 |
| 39. | 58442 | 9.0% | 3.5% (+5.44)#39 | 5.1% (+3.92)#3,157 |
| 40. | 58535 | 8.5% | 3.5% (+4.98)#40 | 5.1% (+3.46)#3,596 |
| 41. | 58426 | 8.3% | 3.5% (+4.80)#41 | 5.1% (+3.28)#3,792 |
| 42. | 58843 | 8.2% | 3.5% (+4.72)#42 | 5.1% (+3.20)#3,858 |
| 43. | 58203 | 7.8% | 3.5% (+4.29)#43 | 5.1% (+2.77)#4,351 |
| 44. | 58006 | 7.6% | 3.5% (+4.10)#44 | 5.1% (+2.58)#4,599 |
| 45. | 58256 | 7.5% | 3.5% (+3.92)#45 | 5.1% (+2.40)#4,912 |
| 46. | 58782 | 7.4% | 3.5% (+3.91)#46 | 5.1% (+2.40)#4,919 |
| 47. | 58562 | 7.4% | 3.5% (+3.88)#47 | 5.1% (+2.36)#4,970 |
| 48. | 58250 | 7.1% | 3.5% (+3.61)#48 | 5.1% (+2.09)#5,396 |
| 49. | 58854 | 7.0% | 3.5% (+3.43)#49 | 5.1% (+1.91)#5,699 |
| 50. | 58438 | 6.9% | 3.5% (+3.36)#50 | 5.1% (+1.85)#5,823 |
| 51. | 58027 | 6.8% | 3.5% (+3.30)#51 | 5.1% (+1.78)#5,955 |
| 52. | 58568 | 6.8% | 3.5% (+3.29)#52 | 5.1% (+1.77)#5,973 |
| 53. | 58422 | 6.8% | 3.5% (+3.29)#53 | 5.1% (+1.77)#5,976 |
| 54. | 58601 | 6.5% | 3.5% (+2.92)#54 | 5.1% (+1.40)#6,752 |
| 55. | 58001 | 6.2% | 3.5% (+2.72)#55 | 5.1% (+1.20)#7,261 |
| 56. | 58081 | 6.2% | 3.5% (+2.64)#56 | 5.1% (+1.12)#7,460 |
| 57. | 58558 | 6.0% | 3.5% (+2.43)#57 | 5.1% (+0.909)#8,061 |
| 58. | 58573 | 6.0% | 3.5% (+2.42)#58 | 5.1% (+0.901)#8,092 |
| 59. | 58701 | 5.9% | 3.5% (+2.38)#59 | 5.1% (+0.861)#8,220 |
| 60. | 58757 | 5.9% | 3.5% (+2.35)#60 | 5.1% (+0.831)#8,316 |
| 61. | 58853 | 5.8% | 3.5% (+2.26)#61 | 5.1% (+0.746)#8,581 |
| 62. | 58249 | 5.7% | 3.5% (+2.18)#62 | 5.1% (+0.663)#8,839 |
| 63. | 58785 | 5.7% | 3.5% (+2.15)#63 | 5.1% (+0.627)#8,956 |
| 64. | 58041 | 5.7% | 3.5% (+2.14)#64 | 5.1% (+0.626)#8,959 |
| 65. | 58421 | 5.6% | 3.5% (+2.08)#65 | 5.1% (+0.561)#9,143 |
| 66. | 58561 | 5.5% | 3.5% (+1.96)#66 | 5.1% (+0.437)#9,562 |
| 67. | 58201 | 5.4% | 3.5% (+1.86)#67 | 5.1% (+0.344)#9,868 |
| 68. | 58773 | 5.4% | 3.5% (+1.85)#68 | 5.1% (+0.333)#9,901 |
| 69. | 58276 | 5.3% | 3.5% (+1.73)#69 | 5.1% (+0.212)#10,298 |
| 70. | 58004 | 5.3% | 3.5% (+1.73)#70 | 5.1% (+0.212)#10,304 |
| 71. | 58048 | 5.2% | 3.5% (+1.68)#71 | 5.1% (+0.157)#10,505 |
| 72. | 58047 | 5.2% | 3.5% (+1.66)#72 | 5.1% (+0.139)#10,582 |
| 73. | 58733 | 5.2% | 3.5% (+1.64)#73 | 5.1% (+0.121)#10,645 |
| 74. | 58761 | 5.1% | 3.5% (+1.61)#74 | 5.1% (+0.096)#10,725 |
| 75. | 58722 | 5.1% | 3.5% (+1.60)#75 | 5.1% (+0.077)#10,793 |
| 76. | 58538 | 4.9% | 3.5% (+1.40)#76 | 5.1% (-0.122)#11,525 |
| 77. | 58049 | 4.3% | 3.5% (+0.816)#77 | 5.1% (-0.703)#13,682 |
| 78. | 58204 | 4.3% | 3.5% (+0.799)#78 | 5.1% (-0.720)#13,746 |
| 79. | 58237 | 4.3% | 3.5% (+0.760)#79 | 5.1% (-0.759)#13,884 |
| 80. | 58413 | 4.2% | 3.5% (+0.710)#80 | 5.1% (-0.809)#14,068 |
| 81. | 58368 | 4.2% | 3.5% (+0.671)#81 | 5.1% (-0.848)#14,211 |
| 82. | 58071 | 4.1% | 3.5% (+0.606)#82 | 5.1% (-0.913)#14,438 |
| 83. | 58775 | 4.0% | 3.5% (+0.468)#83 | 5.1% (-1.05)#14,934 |
| 84. | 58218 | 4.0% | 3.5% (+0.428)#84 | 5.1% (-1.09)#15,070 |
| 85. | 58278 | 3.8% | 3.5% (+0.314)#85 | 5.1% (-1.20)#15,455 |
| 86. | 58703 | 3.8% | 3.5% (+0.310)#86 | 5.1% (-1.21)#15,488 |
| 87. | 58831 | 3.8% | 3.5% (+0.277)#87 | 5.1% (-1.24)#15,590 |
| 88. | 58059 | 3.8% | 3.5% (+0.262)#88 | 5.1% (-1.26)#15,646 |
| 89. | 58103 | 3.8% | 3.5% (+0.254)#89 | 5.1% (-1.27)#15,674 |
| 90. | 58503 | 3.8% | 3.5% (+0.230)#90 | 5.1% (-1.29)#15,750 |
| 91. | 58760 | 3.7% | 3.5% (+0.172)#91 | 5.1% (-1.35)#15,958 |
| 92. | 58501 | 3.7% | 3.5% (+0.137)#92 | 5.1% (-1.38)#16,073 |
| 93. | 58102 | 3.7% | 3.5% (+0.136)#93 | 5.1% (-1.38)#16,076 |
| 94. | 58401 | 3.7% | 3.5% (+0.125)#94 | 5.1% (-1.39)#16,117 |
| 95. | 58448 | 3.5% | 3.5% (-0.023)#95 | 5.1% (-1.54)#16,675 |
| 96. | 58704 | 3.5% | 3.5% (-0.077)#96 | 5.1% (-1.60)#16,833 |
| 97. | 58533 | 3.4% | 3.5% (-0.084)#97 | 5.1% (-1.60)#16,860 |
| 98. | 58441 | 3.4% | 3.5% (-0.084)#98 | 5.1% (-1.60)#16,869 |
| 99. | 58631 | 3.1% | 3.5% (-0.407)#99 | 5.1% (-1.93)#17,872 |
| 100. | 58257 | 3.1% | 3.5% (-0.414)#100 | 5.1% (-1.93)#17,897 |
Common Questions
What are the Top 10 Zip Codes with the Highest Percentage of Population with a Degree in Psychology in North Dakota?
Top 10 Zip Codes with the Highest Percentage of Population with a Degree in Psychology in North Dakota are:
What zip code has the Highest Percentage of Population with a Degree in Psychology in North Dakota?
58430 has the Highest Percentage of Population with a Degree in Psychology in North Dakota with 33.3%.
What is the Percentage of Population with a Degree in Psychology in the State of North Dakota?
Percentage of Population with a Degree in Psychology in North Dakota is 3.5%.
What is the Percentage of Population with a Degree in Psychology in the United States?
Percentage of Population with a Degree in Psychology in the United States is 5.1%.