Zip Codes with the Highest Percentage of Population Enrolled in Nursery / Preschool in North Dakota
RELATED REPORTS & OPTIONS
Nursery / Preschool
North Dakota
Compare Zip Codes
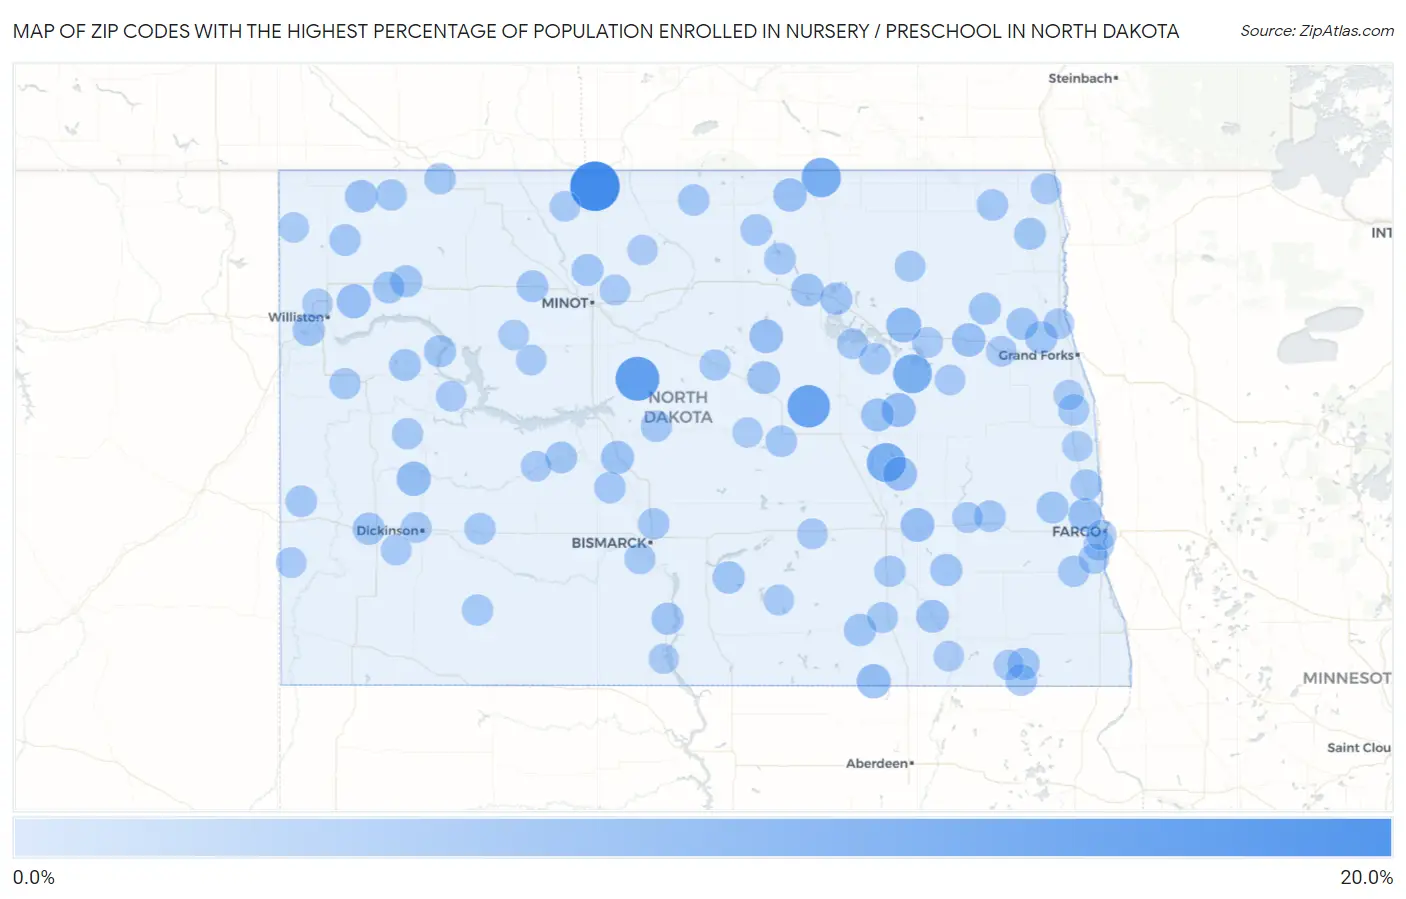
Map of Zip Codes with the Highest Percentage of Population Enrolled in Nursery / Preschool in North Dakota
0.0%
20.0%
Zip Codes with the Highest Percentage of Population Enrolled in Nursery / Preschool in North Dakota
| Zip Code | % in Nursery | vs State | vs National | |
| 1. | 58711 | 17.0% | 1.5%(+15.5)#1 | 1.4%(+15.5)#33 |
| 2. | 58778 | 12.3% | 1.5%(+10.8)#2 | 1.4%(+10.8)#83 |
| 3. | 58422 | 11.2% | 1.5%(+9.78)#3 | 1.4%(+9.79)#100 |
| 4. | 58339 | 8.7% | 1.5%(+7.23)#4 | 1.4%(+7.25)#201 |
| 5. | 58455 | 8.4% | 1.5%(+6.97)#5 | 1.4%(+6.98)#209 |
| 6. | 58380 | 8.3% | 1.5%(+6.81)#6 | 1.4%(+6.83)#218 |
| 7. | 58327 | 5.2% | 1.5%(+3.77)#7 | 1.4%(+3.78)#594 |
| 8. | 58642 | 4.7% | 1.5%(+3.22)#8 | 1.4%(+3.23)#743 |
| 9. | 58439 | 4.6% | 1.5%(+3.12)#9 | 1.4%(+3.14)#787 |
| 10. | 58464 | 4.5% | 1.5%(+3.06)#10 | 1.4%(+3.08)#809 |
| 11. | 58426 | 4.5% | 1.5%(+3.03)#11 | 1.4%(+3.05)#826 |
| 12. | 58843 | 4.5% | 1.5%(+3.03)#12 | 1.4%(+3.04)#829 |
| 13. | 58332 | 4.3% | 1.5%(+2.80)#13 | 1.4%(+2.82)#948 |
| 14. | 58481 | 4.2% | 1.5%(+2.78)#14 | 1.4%(+2.80)#962 |
| 15. | 58042 | 4.1% | 1.5%(+2.60)#15 | 1.4%(+2.62)#1,051 |
| 16. | 58272 | 4.0% | 1.5%(+2.55)#16 | 1.4%(+2.57)#1,081 |
| 17. | 58367 | 3.9% | 1.5%(+2.47)#17 | 1.4%(+2.49)#1,131 |
| 18. | 58577 | 3.9% | 1.5%(+2.39)#18 | 1.4%(+2.41)#1,183 |
| 19. | 58445 | 3.6% | 1.5%(+2.16)#19 | 1.4%(+2.18)#1,384 |
| 20. | 58341 | 3.6% | 1.5%(+2.10)#20 | 1.4%(+2.12)#1,440 |
| 21. | 58458 | 3.5% | 1.5%(+2.08)#21 | 1.4%(+2.09)#1,463 |
| 22. | 58346 | 3.5% | 1.5%(+2.01)#22 | 1.4%(+2.03)#1,535 |
| 23. | 58730 | 3.4% | 1.5%(+1.92)#23 | 1.4%(+1.93)#1,646 |
| 24. | 58258 | 3.3% | 1.5%(+1.79)#24 | 1.4%(+1.80)#1,796 |
| 25. | 58524 | 3.2% | 1.5%(+1.76)#25 | 1.4%(+1.78)#1,842 |
| 26. | 58456 | 3.2% | 1.5%(+1.69)#26 | 1.4%(+1.70)#1,946 |
| 27. | 58325 | 3.1% | 1.5%(+1.66)#27 | 1.4%(+1.68)#1,999 |
| 28. | 58622 | 3.1% | 1.5%(+1.63)#28 | 1.4%(+1.64)#2,056 |
| 29. | 58528 | 3.0% | 1.5%(+1.58)#29 | 1.4%(+1.59)#2,126 |
| 30. | 58461 | 3.0% | 1.5%(+1.55)#30 | 1.4%(+1.56)#2,178 |
| 31. | 58853 | 3.0% | 1.5%(+1.53)#31 | 1.4%(+1.55)#2,206 |
| 32. | 58852 | 3.0% | 1.5%(+1.51)#32 | 1.4%(+1.53)#2,247 |
| 33. | 58231 | 3.0% | 1.5%(+1.50)#33 | 1.4%(+1.51)#2,283 |
| 34. | 58763 | 2.9% | 1.5%(+1.44)#34 | 1.4%(+1.46)#2,416 |
| 35. | 58235 | 2.9% | 1.5%(+1.42)#35 | 1.4%(+1.44)#2,440 |
| 36. | 58276 | 2.8% | 1.5%(+1.38)#36 | 1.4%(+1.40)#2,552 |
| 37. | 58704 | 2.8% | 1.5%(+1.37)#37 | 1.4%(+1.38)#2,589 |
| 38. | 58847 | 2.8% | 1.5%(+1.33)#38 | 1.4%(+1.34)#2,675 |
| 39. | 58067 | 2.8% | 1.5%(+1.33)#39 | 1.4%(+1.34)#2,676 |
| 40. | 58718 | 2.7% | 1.5%(+1.28)#40 | 1.4%(+1.30)#2,771 |
| 41. | 58004 | 2.7% | 1.5%(+1.28)#41 | 1.4%(+1.30)#2,773 |
| 42. | 58545 | 2.7% | 1.5%(+1.23)#42 | 1.4%(+1.24)#2,918 |
| 43. | 58849 | 2.7% | 1.5%(+1.22)#43 | 1.4%(+1.24)#2,932 |
| 44. | 58385 | 2.7% | 1.5%(+1.20)#44 | 1.4%(+1.21)#2,999 |
| 45. | 58063 | 2.6% | 1.5%(+1.16)#45 | 1.4%(+1.18)#3,104 |
| 46. | 58530 | 2.6% | 1.5%(+1.16)#46 | 1.4%(+1.17)#3,115 |
| 47. | 58220 | 2.6% | 1.5%(+1.14)#47 | 1.4%(+1.16)#3,182 |
| 48. | 58366 | 2.6% | 1.5%(+1.14)#48 | 1.4%(+1.15)#3,200 |
| 49. | 58830 | 2.6% | 1.5%(+1.13)#49 | 1.4%(+1.15)#3,204 |
| 50. | 58621 | 2.6% | 1.5%(+1.12)#50 | 1.4%(+1.13)#3,245 |
| 51. | 58559 | 2.6% | 1.5%(+1.11)#51 | 1.4%(+1.12)#3,274 |
| 52. | 58418 | 2.6% | 1.5%(+1.09)#52 | 1.4%(+1.11)#3,316 |
| 53. | 58772 | 2.5% | 1.5%(+1.08)#53 | 1.4%(+1.10)#3,358 |
| 54. | 58652 | 2.5% | 1.5%(+1.05)#54 | 1.4%(+1.07)#3,477 |
| 55. | 58379 | 2.5% | 1.5%(+1.05)#55 | 1.4%(+1.06)#3,496 |
| 56. | 58043 | 2.5% | 1.5%(+1.04)#56 | 1.4%(+1.05)#3,526 |
| 57. | 58036 | 2.5% | 1.5%(+1.01)#57 | 1.4%(+1.03)#3,603 |
| 58. | 58318 | 2.5% | 1.5%(+0.989)#58 | 1.4%(+1.00)#3,703 |
| 59. | 58765 | 2.4% | 1.5%(+0.953)#59 | 1.4%(+0.969)#3,839 |
| 60. | 58503 | 2.4% | 1.5%(+0.936)#60 | 1.4%(+0.952)#3,912 |
| 61. | 58472 | 2.4% | 1.5%(+0.899)#61 | 1.4%(+0.914)#4,073 |
| 62. | 58835 | 2.3% | 1.5%(+0.878)#62 | 1.4%(+0.894)#4,162 |
| 63. | 58640 | 2.3% | 1.5%(+0.872)#63 | 1.4%(+0.887)#4,192 |
| 64. | 58051 | 2.3% | 1.5%(+0.870)#64 | 1.4%(+0.885)#4,204 |
| 65. | 58646 | 2.3% | 1.5%(+0.834)#65 | 1.4%(+0.850)#4,341 |
| 66. | 58218 | 2.3% | 1.5%(+0.797)#66 | 1.4%(+0.813)#4,515 |
| 67. | 58710 | 2.2% | 1.5%(+0.707)#67 | 1.4%(+0.722)#4,999 |
| 68. | 58330 | 2.2% | 1.5%(+0.693)#68 | 1.4%(+0.709)#5,071 |
| 69. | 58433 | 2.1% | 1.5%(+0.671)#69 | 1.4%(+0.687)#5,187 |
| 70. | 58554 | 2.1% | 1.5%(+0.638)#70 | 1.4%(+0.654)#5,397 |
| 71. | 58256 | 2.0% | 1.5%(+0.577)#71 | 1.4%(+0.593)#5,811 |
| 72. | 58601 | 2.0% | 1.5%(+0.572)#72 | 1.4%(+0.588)#5,850 |
| 73. | 58785 | 2.0% | 1.5%(+0.545)#73 | 1.4%(+0.560)#6,048 |
| 74. | 58344 | 2.0% | 1.5%(+0.541)#74 | 1.4%(+0.556)#6,082 |
| 75. | 58271 | 2.0% | 1.5%(+0.519)#75 | 1.4%(+0.534)#6,249 |
| 76. | 58655 | 2.0% | 1.5%(+0.508)#76 | 1.4%(+0.523)#6,333 |
| 77. | 58072 | 2.0% | 1.5%(+0.503)#77 | 1.4%(+0.518)#6,377 |
| 78. | 58335 | 1.9% | 1.5%(+0.475)#78 | 1.4%(+0.490)#6,566 |
| 79. | 58561 | 1.9% | 1.5%(+0.440)#79 | 1.4%(+0.456)#6,814 |
| 80. | 58467 | 1.9% | 1.5%(+0.423)#80 | 1.4%(+0.439)#6,946 |
| 81. | 58632 | 1.9% | 1.5%(+0.416)#81 | 1.4%(+0.432)#7,009 |
| 82. | 58757 | 1.9% | 1.5%(+0.413)#82 | 1.4%(+0.428)#7,037 |
| 83. | 58779 | 1.9% | 1.5%(+0.412)#83 | 1.4%(+0.427)#7,050 |
| 84. | 58523 | 1.9% | 1.5%(+0.387)#84 | 1.4%(+0.402)#7,265 |
| 85. | 58251 | 1.8% | 1.5%(+0.366)#85 | 1.4%(+0.382)#7,455 |
| 86. | 58761 | 1.8% | 1.5%(+0.355)#86 | 1.4%(+0.370)#7,561 |
| 87. | 58104 | 1.8% | 1.5%(+0.352)#87 | 1.4%(+0.367)#7,586 |
| 88. | 58045 | 1.8% | 1.5%(+0.327)#88 | 1.4%(+0.342)#7,820 |
| 89. | 58771 | 1.8% | 1.5%(+0.322)#89 | 1.4%(+0.338)#7,869 |
| 90. | 58047 | 1.8% | 1.5%(+0.313)#90 | 1.4%(+0.329)#7,958 |
| 91. | 58254 | 1.8% | 1.5%(+0.301)#91 | 1.4%(+0.317)#8,078 |
| 92. | 58801 | 1.7% | 1.5%(+0.270)#92 | 1.4%(+0.286)#8,371 |
| 93. | 58474 | 1.7% | 1.5%(+0.257)#93 | 1.4%(+0.272)#8,494 |
| 94. | 58103 | 1.7% | 1.5%(+0.249)#94 | 1.4%(+0.264)#8,572 |
| 95. | 58275 | 1.7% | 1.5%(+0.243)#95 | 1.4%(+0.258)#8,628 |
| 96. | 58845 | 1.7% | 1.5%(+0.216)#96 | 1.4%(+0.231)#8,937 |
| 97. | 58789 | 1.7% | 1.5%(+0.191)#97 | 1.4%(+0.207)#9,243 |
| 98. | 58451 | 1.6% | 1.5%(+0.176)#98 | 1.4%(+0.191)#9,419 |
| 99. | 58032 | 1.6% | 1.5%(+0.167)#99 | 1.4%(+0.183)#9,499 |
| 100. | 58538 | 1.6% | 1.5%(+0.141)#100 | 1.4%(+0.156)#9,792 |
Common Questions
What are the Top 10 Zip Codes with the Highest Percentage of Population Enrolled in Nursery / Preschool in North Dakota?
Top 10 Zip Codes with the Highest Percentage of Population Enrolled in Nursery / Preschool in North Dakota are:
What zip code has the Highest Percentage of Population Enrolled in Nursery / Preschool in North Dakota?
58711 has the Highest Percentage of Population Enrolled in Nursery / Preschool in North Dakota with 17.0%.
What is the Percentage of Population Enrolled in Nursery / Preschool in the State of North Dakota?
Percentage of Population Enrolled in Nursery / Preschool in North Dakota is 1.5%.
What is the Percentage of Population Enrolled in Nursery / Preschool in the United States?
Percentage of Population Enrolled in Nursery / Preschool in the United States is 1.4%.