Zip Codes with the Highest Percentage of Households Residing in Condos/Apartments in North Dakota
RELATED REPORTS & OPTIONS
Condo/Apartment Residency
North Dakota
Compare Zip Codes
Map of Zip Codes with the Highest Percentage of Households Residing in Condos/Apartments in North Dakota
0.0%
100.0%
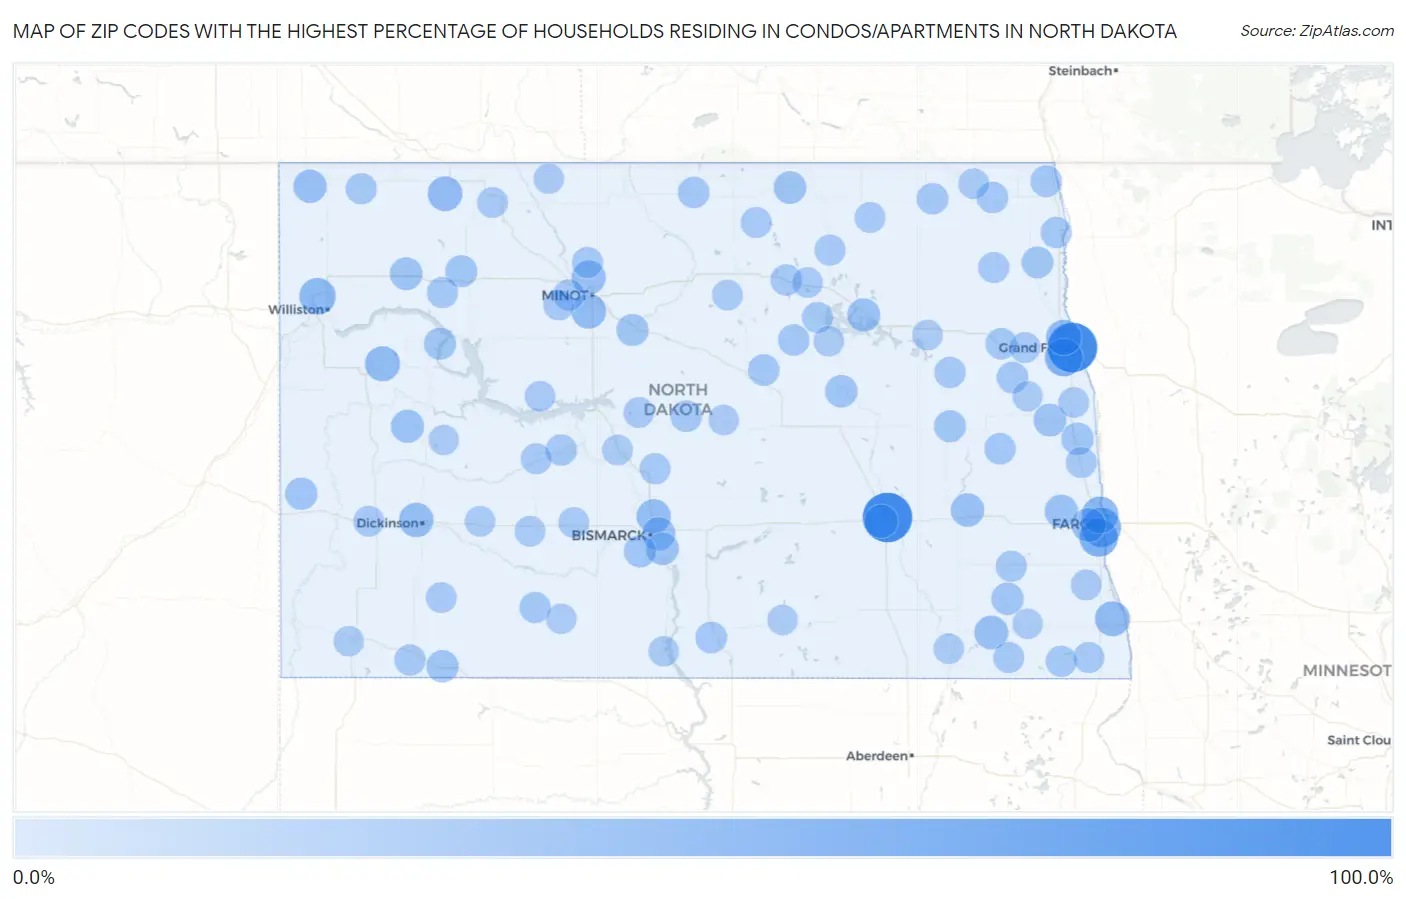
Zip Codes with the Highest Percentage of Households Residing in Condos/Apartments in North Dakota
| Zip Code | Detached Home Residency | vs State | vs National | |
| 1. | 58202 | 100.0% | 20.0% (+80.0)#1 | 13.8% (+86.2)#11 |
| 2. | 58405 | 100.0% | 20.0% (+80.0)#2 | 13.8% (+86.2)#22 |
| 3. | 58103 | 46.8% | 20.0% (+26.8)#3 | 13.8% (+33.0)#644 |
| 4. | 58104 | 42.2% | 20.0% (+22.2)#4 | 13.8% (+28.4)#754 |
| 5. | 58201 | 38.8% | 20.0% (+18.8)#5 | 13.8% (+25.0)#853 |
| 6. | 58102 | 33.6% | 20.0% (+13.6)#6 | 13.8% (+19.8)#1,071 |
| 7. | 58801 | 31.6% | 20.0% (+11.6)#7 | 13.8% (+17.8)#1,181 |
| 8. | 58203 | 26.8% | 20.0% (+6.80)#8 | 13.8% (+13.0)#1,559 |
| 9. | 58854 | 24.9% | 20.0% (+4.90)#9 | 13.8% (+11.1)#1,748 |
| 10. | 58075 | 24.4% | 20.0% (+4.40)#10 | 13.8% (+10.6)#1,793 |
| 11. | 58752 | 23.2% | 20.0% (+3.20)#11 | 13.8% (+9.40)#1,953 |
| 12. | 58701 | 23.0% | 20.0% (+3.00)#12 | 13.8% (+9.20)#1,973 |
| 13. | 58601 | 21.8% | 20.0% (+1.80)#13 | 13.8% (+8.00)#2,119 |
| 14. | 58503 | 20.7% | 20.0% (+0.700)#14 | 13.8% (+6.90)#2,297 |
| 15. | 58078 | 19.8% | 20.0% (-0.200)#15 | 13.8% (+6.00)#2,464 |
| 16. | 58703 | 19.6% | 20.0% (-0.400)#16 | 13.8% (+5.80)#2,508 |
| 17. | 58040 | 18.3% | 20.0% (-1.70)#17 | 13.8% (+4.50)#2,776 |
| 18. | 58401 | 17.4% | 20.0% (-2.60)#18 | 13.8% (+3.60)#2,949 |
| 19. | 58072 | 16.9% | 20.0% (-3.10)#19 | 13.8% (+3.10)#3,069 |
| 20. | 58844 | 16.4% | 20.0% (-3.60)#20 | 13.8% (+2.60)#3,213 |
| 21. | 58012 | 15.7% | 20.0% (-4.30)#21 | 13.8% (+1.90)#3,402 |
| 22. | 58640 | 15.6% | 20.0% (-4.40)#22 | 13.8% (+1.80)#3,427 |
| 23. | 58501 | 15.5% | 20.0% (-4.50)#23 | 13.8% (+1.70)#3,444 |
| 24. | 58301 | 14.9% | 20.0% (-5.10)#24 | 13.8% (+1.10)#3,635 |
| 25. | 58257 | 13.9% | 20.0% (-6.10)#25 | 13.8% (+0.100)#3,944 |
| 26. | 58504 | 13.2% | 20.0% (-6.80)#26 | 13.8% (-0.600)#4,161 |
| 27. | 58852 | 13.2% | 20.0% (-6.80)#27 | 13.8% (-0.600)#4,178 |
| 28. | 58367 | 12.4% | 20.0% (-7.60)#28 | 13.8% (-1.40)#4,468 |
| 29. | 58045 | 11.8% | 20.0% (-8.20)#29 | 13.8% (-2.00)#4,705 |
| 30. | 58054 | 11.7% | 20.0% (-8.30)#30 | 13.8% (-2.10)#4,751 |
| 31. | 58356 | 11.5% | 20.0% (-8.50)#31 | 13.8% (-2.30)#4,833 |
| 32. | 58554 | 11.0% | 20.0% (-9.00)#32 | 13.8% (-2.80)#5,029 |
| 33. | 58639 | 11.0% | 20.0% (-9.00)#33 | 13.8% (-2.80)#5,053 |
| 34. | 58621 | 10.5% | 20.0% (-9.50)#34 | 13.8% (-3.30)#5,276 |
| 35. | 58790 | 9.5% | 20.0% (-10.5)#35 | 13.8% (-4.30)#5,780 |
| 36. | 58763 | 9.1% | 20.0% (-10.9)#36 | 13.8% (-4.70)#5,985 |
| 37. | 58784 | 9.0% | 20.0% (-11.0)#37 | 13.8% (-4.80)#6,043 |
| 38. | 58425 | 8.9% | 20.0% (-11.1)#38 | 13.8% (-4.90)#6,093 |
| 39. | 58237 | 8.3% | 20.0% (-11.7)#39 | 13.8% (-5.50)#6,498 |
| 40. | 58552 | 7.7% | 20.0% (-12.3)#40 | 13.8% (-6.10)#6,922 |
| 41. | 58318 | 7.3% | 20.0% (-12.7)#41 | 13.8% (-6.50)#7,184 |
| 42. | 58249 | 7.3% | 20.0% (-12.7)#42 | 13.8% (-6.50)#7,188 |
| 43. | 58271 | 7.3% | 20.0% (-12.7)#43 | 13.8% (-6.50)#7,193 |
| 44. | 58341 | 7.2% | 20.0% (-12.8)#44 | 13.8% (-6.60)#7,252 |
| 45. | 58267 | 7.1% | 20.0% (-12.9)#45 | 13.8% (-6.70)#7,337 |
| 46. | 58463 | 6.9% | 20.0% (-13.1)#46 | 13.8% (-6.90)#7,493 |
| 47. | 58348 | 6.8% | 20.0% (-13.2)#47 | 13.8% (-7.00)#7,577 |
| 48. | 58220 | 6.7% | 20.0% (-13.3)#48 | 13.8% (-7.10)#7,654 |
| 49. | 58046 | 6.7% | 20.0% (-13.3)#49 | 13.8% (-7.10)#7,661 |
| 50. | 58251 | 6.6% | 20.0% (-13.4)#50 | 13.8% (-7.20)#7,747 |
| 51. | 58722 | 6.4% | 20.0% (-13.6)#51 | 13.8% (-7.40)#7,915 |
| 52. | 58545 | 6.1% | 20.0% (-13.9)#52 | 13.8% (-7.70)#8,169 |
| 53. | 58386 | 6.1% | 20.0% (-13.9)#53 | 13.8% (-7.70)#8,177 |
| 54. | 58225 | 5.8% | 20.0% (-14.2)#54 | 13.8% (-8.00)#8,451 |
| 55. | 58254 | 5.7% | 20.0% (-14.3)#55 | 13.8% (-8.10)#8,543 |
| 56. | 58533 | 5.5% | 20.0% (-14.5)#56 | 13.8% (-8.30)#8,740 |
| 57. | 58704 | 5.1% | 20.0% (-14.9)#57 | 13.8% (-8.70)#9,061 |
| 58. | 58730 | 5.1% | 20.0% (-14.9)#58 | 13.8% (-8.70)#9,078 |
| 59. | 58649 | 5.1% | 20.0% (-14.9)#59 | 13.8% (-8.70)#9,086 |
| 60. | 58053 | 5.0% | 20.0% (-15.0)#60 | 13.8% (-8.80)#9,165 |
| 61. | 58776 | 4.9% | 20.0% (-15.1)#61 | 13.8% (-8.90)#9,271 |
| 62. | 58041 | 4.7% | 20.0% (-15.3)#62 | 13.8% (-9.10)#9,490 |
| 63. | 58579 | 4.7% | 20.0% (-15.3)#63 | 13.8% (-9.10)#9,495 |
| 64. | 58027 | 4.5% | 20.0% (-15.5)#64 | 13.8% (-9.30)#9,692 |
| 65. | 58032 | 4.5% | 20.0% (-15.5)#65 | 13.8% (-9.30)#9,701 |
| 66. | 58351 | 4.5% | 20.0% (-15.5)#66 | 13.8% (-9.30)#9,707 |
| 67. | 58270 | 4.3% | 20.0% (-15.7)#67 | 13.8% (-9.50)#9,905 |
| 68. | 58038 | 4.3% | 20.0% (-15.7)#68 | 13.8% (-9.50)#9,922 |
| 69. | 58324 | 4.2% | 20.0% (-15.8)#69 | 13.8% (-9.60)#10,026 |
| 70. | 58366 | 4.2% | 20.0% (-15.8)#70 | 13.8% (-9.60)#10,030 |
| 71. | 58746 | 3.8% | 20.0% (-16.2)#71 | 13.8% (-10.00)#10,532 |
| 72. | 58523 | 3.7% | 20.0% (-16.3)#72 | 13.8% (-10.1)#10,654 |
| 73. | 58622 | 3.4% | 20.0% (-16.6)#73 | 13.8% (-10.4)#11,077 |
| 74. | 58733 | 3.4% | 20.0% (-16.6)#74 | 13.8% (-10.4)#11,104 |
| 75. | 58214 | 3.3% | 20.0% (-16.7)#75 | 13.8% (-10.5)#11,252 |
| 76. | 58368 | 3.2% | 20.0% (-16.8)#76 | 13.8% (-10.6)#11,348 |
| 77. | 58575 | 3.2% | 20.0% (-16.8)#77 | 13.8% (-10.6)#11,382 |
| 78. | 58650 | 3.1% | 20.0% (-16.9)#78 | 13.8% (-10.7)#11,534 |
| 79. | 58577 | 3.0% | 20.0% (-17.0)#79 | 13.8% (-10.8)#11,677 |
| 80. | 58563 | 2.9% | 20.0% (-17.1)#80 | 13.8% (-10.9)#11,845 |
| 81. | 58631 | 2.9% | 20.0% (-17.1)#81 | 13.8% (-10.9)#11,867 |
| 82. | 58352 | 2.9% | 20.0% (-17.1)#82 | 13.8% (-10.9)#11,878 |
| 83. | 58282 | 2.8% | 20.0% (-17.2)#83 | 13.8% (-11.0)#12,028 |
| 84. | 58218 | 2.6% | 20.0% (-17.4)#84 | 13.8% (-11.2)#12,389 |
| 85. | 58540 | 2.4% | 20.0% (-17.6)#85 | 13.8% (-11.4)#12,699 |
| 86. | 58077 | 2.4% | 20.0% (-17.6)#86 | 13.8% (-11.4)#12,751 |
| 87. | 58346 | 2.4% | 20.0% (-17.6)#87 | 13.8% (-11.4)#12,756 |
| 88. | 58474 | 2.3% | 20.0% (-17.7)#88 | 13.8% (-11.5)#12,896 |
| 89. | 58444 | 2.3% | 20.0% (-17.7)#89 | 13.8% (-11.5)#12,947 |
| 90. | 58357 | 2.2% | 20.0% (-17.8)#90 | 13.8% (-11.6)#13,138 |
| 91. | 58538 | 1.9% | 20.0% (-18.1)#91 | 13.8% (-11.9)#13,699 |
| 92. | 58652 | 1.9% | 20.0% (-18.1)#92 | 13.8% (-11.9)#13,725 |
| 93. | 58344 | 1.9% | 20.0% (-18.1)#93 | 13.8% (-11.9)#13,733 |
| 94. | 58623 | 1.8% | 20.0% (-18.2)#94 | 13.8% (-12.0)#13,894 |
| 95. | 58495 | 1.8% | 20.0% (-18.2)#95 | 13.8% (-12.0)#13,919 |
| 96. | 58529 | 1.7% | 20.0% (-18.3)#96 | 13.8% (-12.1)#14,150 |
| 97. | 58782 | 1.6% | 20.0% (-18.4)#97 | 13.8% (-12.2)#14,376 |
| 98. | 58060 | 1.5% | 20.0% (-18.5)#98 | 13.8% (-12.3)#14,576 |
| 99. | 58626 | 1.5% | 20.0% (-18.5)#99 | 13.8% (-12.3)#14,587 |
| 100. | 58240 | 1.4% | 20.0% (-18.6)#100 | 13.8% (-12.4)#14,787 |
Common Questions
What are the Top 10 Zip Codes with the Highest Percentage of Households Residing in Condos/Apartments in North Dakota?
Top 10 Zip Codes with the Highest Percentage of Households Residing in Condos/Apartments in North Dakota are:
What zip code has the Highest Percentage of Households Residing in Condos/Apartments in North Dakota?
58202 has the Highest Percentage of Households Residing in Condos/Apartments in North Dakota with 100.0%.
What is the Percentage of Households Residing in Condos/Apartments in the State of North Dakota?
Percentage of Households Residing in Condos/Apartments in North Dakota is 20.0%.
What is the Percentage of Households Residing in Condos/Apartments in the United States?
Percentage of Households Residing in Condos/Apartments in the United States is 13.8%.