Zip Codes with the Highest Percentage of Population Employed in Construction & Extraction in North Dakota
RELATED REPORTS & OPTIONS
Construction & Extraction
North Dakota
Compare Zip Codes
Map of Zip Codes with the Highest Percentage of Population Employed in Construction & Extraction in North Dakota
0.0%
80.0%
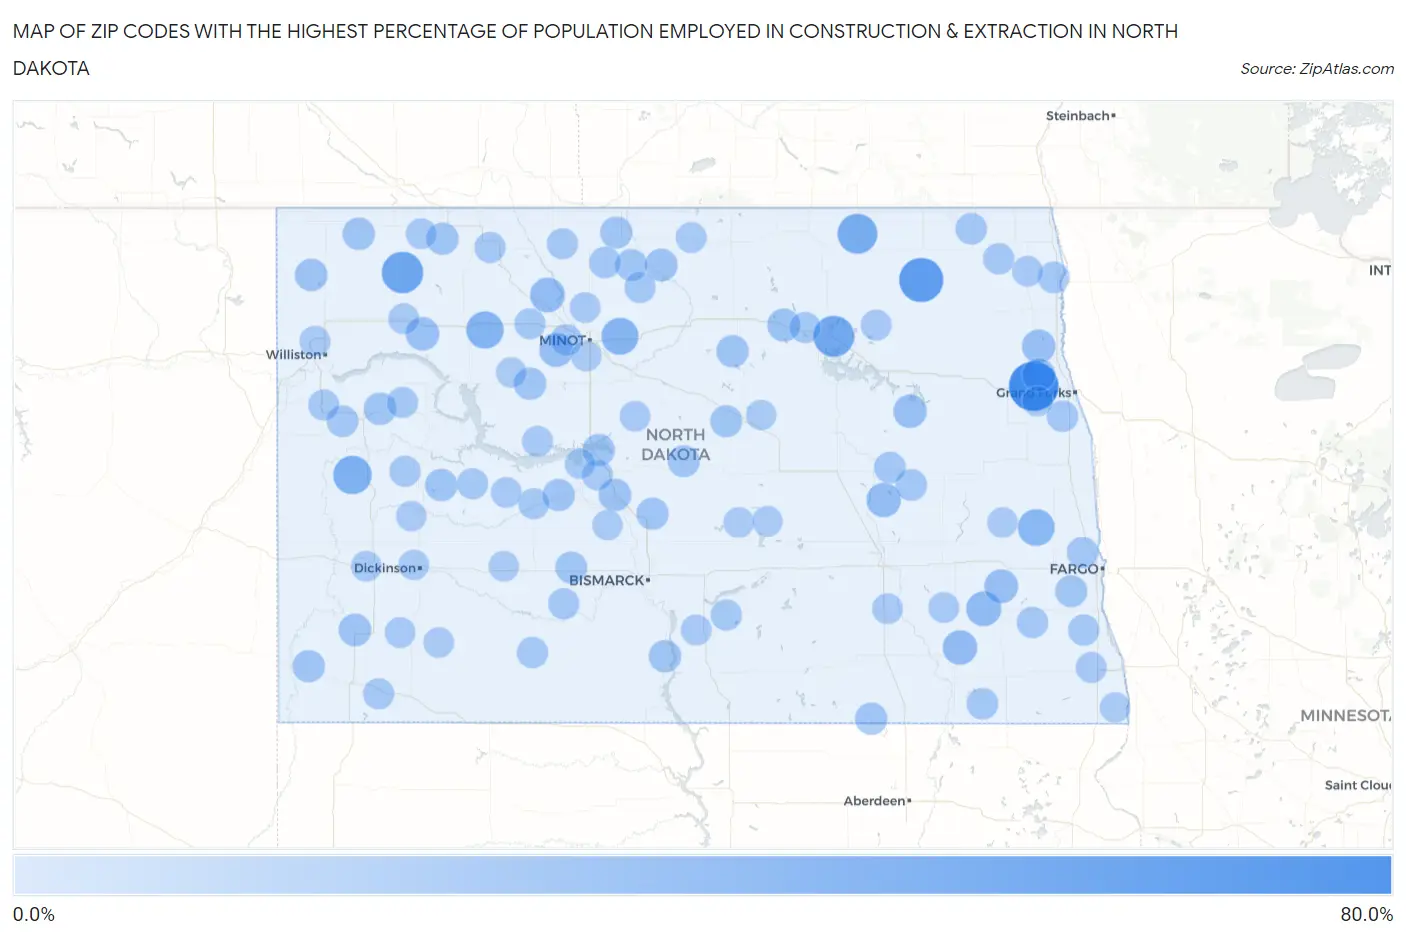
Zip Codes with the Highest Percentage of Population Employed in Construction & Extraction in North Dakota
| Zip Code | % Employed | vs State | vs National | |
| 1. | 58205 | 66.7% | 5.8% (+60.9)#1 | 5.0% (+61.7)#59 |
| 2. | 58355 | 50.0% | 5.8% (+44.2)#2 | 5.0% (+45.0)#131 |
| 3. | 58755 | 41.6% | 5.8% (+35.8)#3 | 5.0% (+36.6)#195 |
| 4. | 58325 | 40.0% | 5.8% (+34.2)#4 | 5.0% (+35.0)#218 |
| 5. | 58323 | 36.7% | 5.8% (+30.9)#5 | 5.0% (+31.7)#265 |
| 6. | 58634 | 32.4% | 5.8% (+26.6)#6 | 5.0% (+27.4)#347 |
| 7. | 58769 | 29.0% | 5.8% (+23.2)#7 | 5.0% (+24.0)#421 |
| 8. | 58768 | 28.0% | 5.8% (+22.2)#8 | 5.0% (+23.0)#465 |
| 9. | 58029 | 27.3% | 5.8% (+21.5)#9 | 5.0% (+22.3)#498 |
| 10. | 58062 | 21.6% | 5.8% (+15.8)#10 | 5.0% (+16.6)#828 |
| 11. | 58725 | 21.2% | 5.8% (+15.4)#11 | 5.0% (+16.2)#868 |
| 12. | 58490 | 20.5% | 5.8% (+14.7)#12 | 5.0% (+15.5)#940 |
| 13. | 58455 | 20.0% | 5.8% (+14.2)#13 | 5.0% (+15.0)#994 |
| 14. | 58733 | 18.8% | 5.8% (+13.0)#14 | 5.0% (+13.8)#1,171 |
| 15. | 58031 | 18.6% | 5.8% (+12.8)#15 | 5.0% (+13.6)#1,195 |
| 16. | 58380 | 17.6% | 5.8% (+11.8)#16 | 5.0% (+12.6)#1,367 |
| 17. | 58794 | 17.4% | 5.8% (+11.6)#17 | 5.0% (+12.4)#1,396 |
| 18. | 58261 | 17.4% | 5.8% (+11.6)#18 | 5.0% (+12.4)#1,407 |
| 19. | 58258 | 16.8% | 5.8% (+11.0)#19 | 5.0% (+11.8)#1,505 |
| 20. | 58386 | 15.8% | 5.8% (+9.99)#20 | 5.0% (+10.8)#1,773 |
| 21. | 58620 | 14.9% | 5.8% (+9.07)#21 | 5.0% (+9.87)#2,082 |
| 22. | 58748 | 14.8% | 5.8% (+9.02)#22 | 5.0% (+9.82)#2,098 |
| 23. | 58577 | 14.8% | 5.8% (+9.01)#23 | 5.0% (+9.82)#2,099 |
| 24. | 58856 | 14.7% | 5.8% (+8.91)#24 | 5.0% (+9.71)#2,157 |
| 25. | 58854 | 14.6% | 5.8% (+8.77)#25 | 5.0% (+9.57)#2,211 |
| 26. | 58730 | 14.5% | 5.8% (+8.75)#26 | 5.0% (+9.55)#2,221 |
| 27. | 58528 | 14.3% | 5.8% (+8.49)#27 | 5.0% (+9.29)#2,315 |
| 28. | 58756 | 14.3% | 5.8% (+8.49)#28 | 5.0% (+9.29)#2,325 |
| 29. | 58313 | 14.3% | 5.8% (+8.49)#29 | 5.0% (+9.29)#2,335 |
| 30. | 58651 | 14.1% | 5.8% (+8.32)#30 | 5.0% (+9.13)#2,397 |
| 31. | 58626 | 14.1% | 5.8% (+8.28)#31 | 5.0% (+9.09)#2,422 |
| 32. | 58752 | 13.9% | 5.8% (+8.13)#32 | 5.0% (+8.93)#2,497 |
| 33. | 58439 | 13.9% | 5.8% (+8.11)#33 | 5.0% (+8.91)#2,506 |
| 34. | 58579 | 13.7% | 5.8% (+7.89)#34 | 5.0% (+8.70)#2,611 |
| 35. | 58793 | 13.7% | 5.8% (+7.87)#35 | 5.0% (+8.68)#2,619 |
| 36. | 58545 | 13.6% | 5.8% (+7.83)#36 | 5.0% (+8.63)#2,641 |
| 37. | 58531 | 13.5% | 5.8% (+7.66)#37 | 5.0% (+8.47)#2,727 |
| 38. | 58021 | 13.0% | 5.8% (+7.19)#38 | 5.0% (+7.99)#2,941 |
| 39. | 58758 | 12.8% | 5.8% (+7.05)#39 | 5.0% (+7.85)#3,022 |
| 40. | 58563 | 12.8% | 5.8% (+7.02)#40 | 5.0% (+7.82)#3,043 |
| 41. | 58463 | 12.8% | 5.8% (+7.00)#41 | 5.0% (+7.80)#3,053 |
| 42. | 58762 | 12.5% | 5.8% (+6.70)#42 | 5.0% (+7.51)#3,265 |
| 43. | 58835 | 12.2% | 5.8% (+6.37)#43 | 5.0% (+7.18)#3,471 |
| 44. | 58722 | 12.0% | 5.8% (+6.24)#44 | 5.0% (+7.05)#3,562 |
| 45. | 58760 | 12.0% | 5.8% (+6.24)#45 | 5.0% (+7.04)#3,565 |
| 46. | 58484 | 11.9% | 5.8% (+6.11)#46 | 5.0% (+6.91)#3,648 |
| 47. | 58225 | 11.9% | 5.8% (+6.08)#47 | 5.0% (+6.89)#3,663 |
| 48. | 58443 | 11.8% | 5.8% (+6.04)#48 | 5.0% (+6.85)#3,693 |
| 49. | 58282 | 11.7% | 5.8% (+5.93)#49 | 5.0% (+6.74)#3,780 |
| 50. | 58017 | 11.7% | 5.8% (+5.93)#50 | 5.0% (+6.73)#3,789 |
| 51. | 58278 | 11.4% | 5.8% (+5.62)#51 | 5.0% (+6.42)#4,023 |
| 52. | 58042 | 11.3% | 5.8% (+5.53)#52 | 5.0% (+6.34)#4,085 |
| 53. | 58068 | 11.1% | 5.8% (+5.31)#53 | 5.0% (+6.12)#4,279 |
| 54. | 58241 | 11.0% | 5.8% (+5.18)#54 | 5.0% (+5.98)#4,389 |
| 55. | 58533 | 10.8% | 5.8% (+5.02)#55 | 5.0% (+5.82)#4,546 |
| 56. | 58520 | 10.8% | 5.8% (+4.96)#56 | 5.0% (+5.77)#4,595 |
| 57. | 58077 | 10.7% | 5.8% (+4.93)#57 | 5.0% (+5.74)#4,618 |
| 58. | 58524 | 10.7% | 5.8% (+4.92)#58 | 5.0% (+5.72)#4,643 |
| 59. | 58789 | 10.7% | 5.8% (+4.88)#59 | 5.0% (+5.68)#4,673 |
| 60. | 58636 | 10.7% | 5.8% (+4.86)#60 | 5.0% (+5.67)#4,690 |
| 61. | 58346 | 10.5% | 5.8% (+4.75)#61 | 5.0% (+5.55)#4,808 |
| 62. | 58640 | 10.5% | 5.8% (+4.73)#62 | 5.0% (+5.53)#4,827 |
| 63. | 58761 | 10.5% | 5.8% (+4.70)#63 | 5.0% (+5.50)#4,857 |
| 64. | 58746 | 10.3% | 5.8% (+4.48)#64 | 5.0% (+5.29)#5,100 |
| 65. | 58847 | 10.3% | 5.8% (+4.48)#65 | 5.0% (+5.29)#5,105 |
| 66. | 58653 | 10.2% | 5.8% (+4.42)#66 | 5.0% (+5.22)#5,163 |
| 67. | 58831 | 10.1% | 5.8% (+4.34)#67 | 5.0% (+5.15)#5,232 |
| 68. | 58523 | 10.1% | 5.8% (+4.29)#68 | 5.0% (+5.10)#5,289 |
| 69. | 58718 | 10.1% | 5.8% (+4.29)#69 | 5.0% (+5.09)#5,299 |
| 70. | 58576 | 9.9% | 5.8% (+4.09)#70 | 5.0% (+4.90)#5,535 |
| 71. | 58061 | 9.9% | 5.8% (+4.08)#71 | 5.0% (+4.88)#5,556 |
| 72. | 58852 | 9.8% | 5.8% (+3.98)#72 | 5.0% (+4.79)#5,672 |
| 73. | 58318 | 9.7% | 5.8% (+3.89)#73 | 5.0% (+4.69)#5,770 |
| 74. | 58540 | 9.7% | 5.8% (+3.88)#74 | 5.0% (+4.69)#5,782 |
| 75. | 58382 | 9.7% | 5.8% (+3.88)#75 | 5.0% (+4.68)#5,796 |
| 76. | 58461 | 9.5% | 5.8% (+3.75)#76 | 5.0% (+4.55)#5,975 |
| 77. | 58647 | 9.5% | 5.8% (+3.66)#77 | 5.0% (+4.47)#6,086 |
| 78. | 58727 | 9.4% | 5.8% (+3.64)#78 | 5.0% (+4.44)#6,130 |
| 79. | 58544 | 9.4% | 5.8% (+3.59)#79 | 5.0% (+4.39)#6,190 |
| 80. | 58472 | 9.4% | 5.8% (+3.58)#80 | 5.0% (+4.38)#6,204 |
| 81. | 58801 | 9.3% | 5.8% (+3.54)#81 | 5.0% (+4.35)#6,252 |
| 82. | 58704 | 9.3% | 5.8% (+3.47)#82 | 5.0% (+4.27)#6,354 |
| 83. | 58778 | 9.1% | 5.8% (+3.29)#83 | 5.0% (+4.10)#6,633 |
| 84. | 58276 | 9.0% | 5.8% (+3.21)#84 | 5.0% (+4.01)#6,750 |
| 85. | 58622 | 9.0% | 5.8% (+3.16)#85 | 5.0% (+3.97)#6,817 |
| 86. | 58541 | 9.0% | 5.8% (+3.16)#86 | 5.0% (+3.97)#6,818 |
| 87. | 58771 | 8.7% | 5.8% (+2.88)#87 | 5.0% (+3.68)#7,291 |
| 88. | 58488 | 8.6% | 5.8% (+2.77)#88 | 5.0% (+3.58)#7,469 |
| 89. | 58601 | 8.6% | 5.8% (+2.76)#89 | 5.0% (+3.57)#7,485 |
| 90. | 58650 | 8.5% | 5.8% (+2.70)#90 | 5.0% (+3.51)#7,582 |
| 91. | 58638 | 8.4% | 5.8% (+2.57)#91 | 5.0% (+3.38)#7,812 |
| 92. | 58064 | 8.4% | 5.8% (+2.57)#92 | 5.0% (+3.38)#7,814 |
| 93. | 58565 | 8.3% | 5.8% (+2.53)#93 | 5.0% (+3.34)#7,881 |
| 94. | 58478 | 8.3% | 5.8% (+2.53)#94 | 5.0% (+3.34)#7,883 |
| 95. | 58228 | 8.3% | 5.8% (+2.49)#95 | 5.0% (+3.30)#7,939 |
| 96. | 58701 | 8.3% | 5.8% (+2.49)#96 | 5.0% (+3.30)#7,942 |
| 97. | 58530 | 8.2% | 5.8% (+2.44)#97 | 5.0% (+3.25)#8,026 |
| 98. | 58642 | 8.2% | 5.8% (+2.40)#98 | 5.0% (+3.20)#8,113 |
| 99. | 58030 | 8.2% | 5.8% (+2.38)#99 | 5.0% (+3.18)#8,141 |
| 100. | 58341 | 8.1% | 5.8% (+2.34)#100 | 5.0% (+3.15)#8,203 |
Common Questions
What are the Top 10 Zip Codes with the Highest Percentage of Population Employed in Construction & Extraction in North Dakota?
Top 10 Zip Codes with the Highest Percentage of Population Employed in Construction & Extraction in North Dakota are:
What zip code has the Highest Percentage of Population Employed in Construction & Extraction in North Dakota?
58205 has the Highest Percentage of Population Employed in Construction & Extraction in North Dakota with 66.7%.
What is the Percentage of Population Employed in Construction & Extraction in the State of North Dakota?
Percentage of Population Employed in Construction & Extraction in North Dakota is 5.8%.
What is the Percentage of Population Employed in Construction & Extraction in the United States?
Percentage of Population Employed in Construction & Extraction in the United States is 5.0%.