Zip Codes with the Highest Percentage of Self-Employed / Incorporated in Minneapolis, MN

RELATED REPORTS & OPTIONS

Self-Employed / Incorporated
Population
Families and Households
Female Fertility
Female Fertility (Unmarried)
Race (Community Size)
Race (Percentage)
Ancestry (Community Size)
AfghanAfricanAlaska NativeAlbanianAlsatianAmericanApacheArabArgentineanArmenianAssyrian / Chaldean / SyriacAustralianAustrianBahamianBangladeshiBarbadianBasqueBelgianBelizeanBhutaneseBlackfeetBolivianBrazilianBritishBritish West IndianBulgarianBurmeseCajunCambodianCanadianCape VerdeanCarpatho RusynCelticCentral AmericanCentral American IndianCherokeeCheyenneChickasawChileanChippewaChoctawColombianComancheCosta RicanCreeCreekCroatianCrowCubanCypriotCzechCzechoslovakianDanishDominicanDutchEastern EuropeanEcuadorianEgyptianEnglishEstonianEthiopianEuropeanFijianFilipinoFinnishFrenchFrench American IndianFrench CanadianGermanGerman RussianGhanaianGreekGuamanian / ChamorroGuatemalanGuyaneseHaitianHonduranHungarianIcelanderIndian (Asian)IndonesianInupiatIranianIraqiIrishIroquoisIsraeliItalianJamaicanJapaneseJordanianKenyanKoreanLaotianLatvianLebaneseLiberianLithuanianLuxembourgerMacedonianMalaysianMalteseMenomineeMexicanMexican American IndianMongolianMoroccanNative HawaiianNavajoNicaraguanNigerianNorthern EuropeanNorwegianOkinawanOsagePakistaniPalestinianPanamanianParaguayanPennsylvania GermanPeruvianPolishPortuguesePotawatomiPuerto RicanRomanianRussianSalvadoranSamoanScandinavianScotch-IrishScottishSenegaleseSerbianSierra LeoneanSiouxSlavicSlovakSloveneSomaliSouth AfricanSouth AmericanSouth American IndianSoviet UnionSpaniardSpanishSri LankanSubsaharan AfricanSudaneseSwedishSwissSyrianThaiTonganTrinidadian and TobagonianTurkishUgandanUkrainianUruguayanVenezuelanVietnameseWelshWest IndianYugoslavian
Ancestry (Percentage)
AfghanAfricanAlaska NativeAlbanianAlsatianAmericanApacheArabArgentineanArmenianAssyrian / Chaldean / SyriacAustralianAustrianBahamianBangladeshiBarbadianBasqueBelgianBelizeanBhutaneseBlackfeetBolivianBrazilianBritishBritish West IndianBulgarianBurmeseCajunCambodianCanadianCape VerdeanCarpatho RusynCelticCentral AmericanCentral American IndianCherokeeCheyenneChickasawChileanChippewaChoctawColombianComancheCosta RicanCreeCreekCroatianCrowCubanCypriotCzechCzechoslovakianDanishDominicanDutchEastern EuropeanEcuadorianEgyptianEnglishEstonianEthiopianEuropeanFijianFilipinoFinnishFrenchFrench American IndianFrench CanadianGermanGerman RussianGhanaianGreekGuamanian / ChamorroGuatemalanGuyaneseHaitianHonduranHungarianIcelanderIndian (Asian)IndonesianInupiatIranianIraqiIrishIroquoisIsraeliItalianJamaicanJapaneseJordanianKenyanKoreanLaotianLatvianLebaneseLiberianLithuanianLuxembourgerMacedonianMalaysianMalteseMenomineeMexicanMexican American IndianMongolianMoroccanNative HawaiianNavajoNicaraguanNigerianNorthern EuropeanNorwegianOkinawanOsagePakistaniPalestinianPanamanianParaguayanPennsylvania GermanPeruvianPolishPortuguesePotawatomiPuerto RicanRomanianRussianSalvadoranSamoanScandinavianScotch-IrishScottishSenegaleseSerbianSierra LeoneanSiouxSlavicSlovakSloveneSomaliSouth AfricanSouth AmericanSouth American IndianSoviet UnionSpaniardSpanishSri LankanSubsaharan AfricanSudaneseSwedishSwissSyrianThaiTonganTrinidadian and TobagonianTurkishUgandanUkrainianUruguayanVenezuelanVietnameseWelshWest IndianYugoslavian
Immigrant Origin (Total)
AfghanistanAfricaAlbaniaArgentinaAsiaAustraliaAustriaBahamasBangladeshBarbadosBelarusBelgiumBelizeBoliviaBosnia and HerzegovinaBrazilBulgariaBurma / MyanmarCabo VerdeCambodiaCameroonCanadaCaribbeanCentral AmericaChileChinaColombiaCongoCosta RicaCroatiaCubaCzechoslovakiaDenmarkDominican RepublicEastern AfricaEastern AsiaEastern EuropeEcuadorEgyptEl SalvadorEnglandEritreaEthiopiaEuropeFranceGermanyGhanaGreeceGuatemalaGuyanaHaitiHondurasHong KongHungaryIndiaIndonesiaIranIraqIrelandIsraelItalyJamaicaJapanJordanKazakhstanKenyaKoreaKuwaitLaosLatin AmericaLatviaLebanonLiberiaLithuaniaMalaysiaMexicoMicronesiaMiddle AfricaMoldovaMoroccoNepalNetherlandsNicaraguaNigeriaNorthern AfricaNorthern EuropeNorwayOceaniaPakistanPanamaPeruPhilippinesPolandRomaniaRussiaSaudi ArabiaScotlandSenegalSerbiaSierra LeoneSingaporeSomaliaSouth AfricaSouth AmericaSouth Central AsiaSouth Eastern AsiaSouthern EuropeSpainSri LankaSudanSwedenSwitzerlandSyriaTaiwanThailandTrinidad and TobagoTurkeyUgandaUkraineUruguayUzbekistanVenezuelaVietnamWestern AfricaWestern AsiaWestern EuropeYemenZaireZimbabwe
Immigrant Origin (Percentage)
AfghanistanAfricaAlbaniaArgentinaAsiaAustraliaAustriaBahamasBangladeshBarbadosBelarusBelgiumBelizeBoliviaBosnia and HerzegovinaBrazilBulgariaBurma / MyanmarCabo VerdeCambodiaCameroonCanadaCaribbeanCentral AmericaChileChinaColombiaCongoCosta RicaCroatiaCubaCzechoslovakiaDenmarkDominican RepublicEastern AfricaEastern AsiaEastern EuropeEcuadorEgyptEl SalvadorEnglandEritreaEthiopiaEuropeFranceGermanyGhanaGreeceGuatemalaGuyanaHaitiHondurasHong KongHungaryIndiaIndonesiaIranIraqIrelandIsraelItalyJamaicaJapanJordanKazakhstanKenyaKoreaKuwaitLaosLatin AmericaLatviaLebanonLiberiaLithuaniaMalaysiaMexicoMicronesiaMiddle AfricaMoldovaMoroccoNepalNetherlandsNicaraguaNigeriaNorthern AfricaNorthern EuropeNorwayOceaniaPakistanPanamaPeruPhilippinesPolandRomaniaRussiaSaudi ArabiaScotlandSenegalSerbiaSierra LeoneSingaporeSomaliaSouth AfricaSouth AmericaSouth Central AsiaSouth Eastern AsiaSouthern EuropeSpainSri LankaSudanSwedenSwitzerlandSyriaTaiwanThailandTrinidad and TobagoTurkeyUgandaUkraineUruguayUzbekistanVenezuelaVietnamWestern AfricaWestern AsiaWestern EuropeYemenZaireZimbabwe
Income
Income (Families)
Income (Households)
Poverty
Poverty (Families)
Unemployment
Employment Occupations
Employment Industries
Employer Class
Commute Time
Commute Means
School Enrollment
Education by Degree Field
Occupancy
Finances
Physical Characteristics
Minneapolis
Compare Zip Codes
Comparison Subject

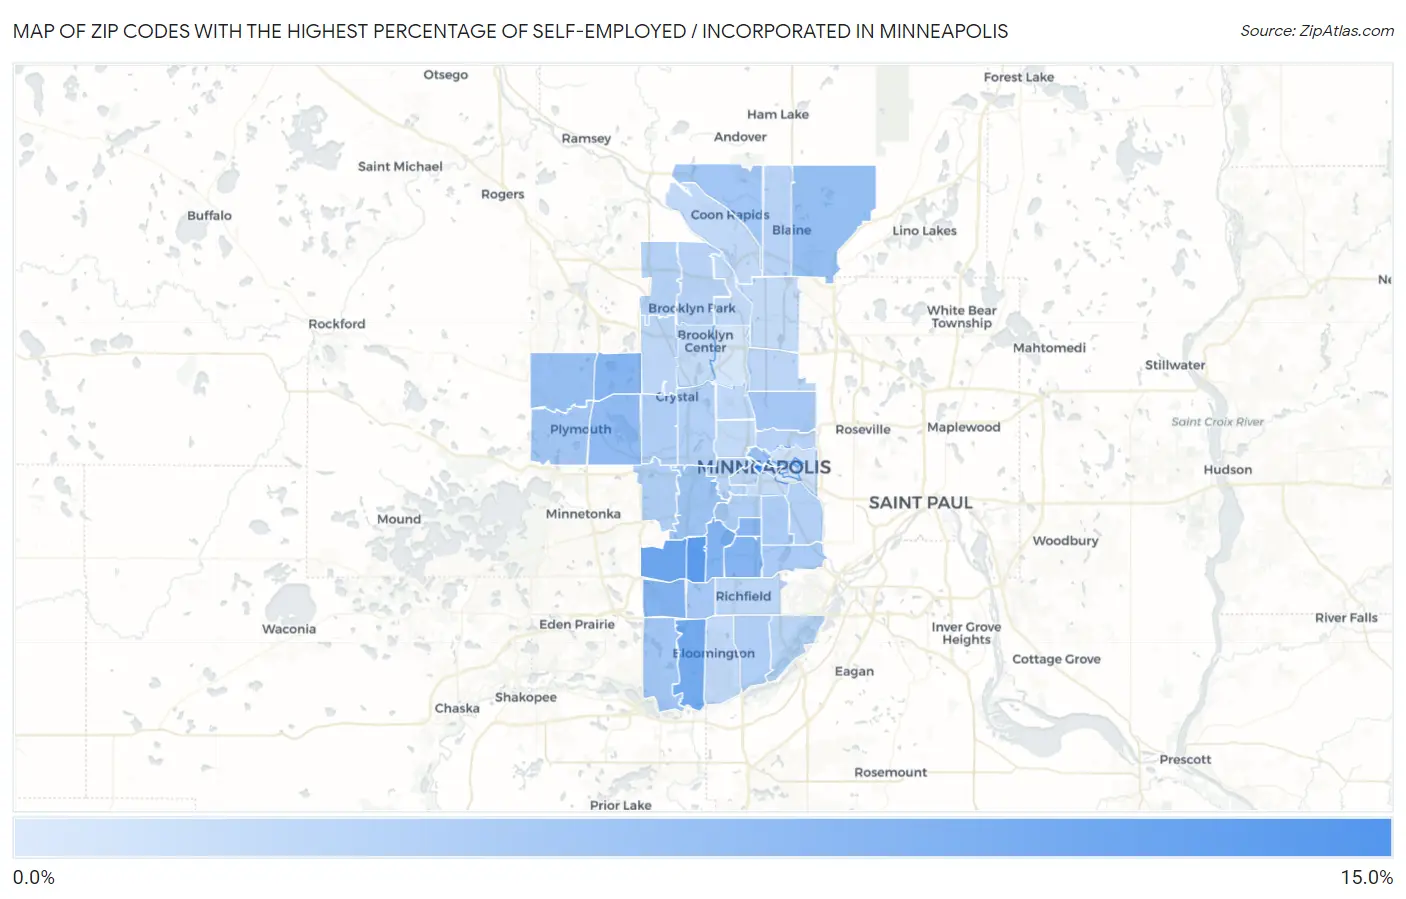
Map of Zip Codes with the Highest Percentage of Self-Employed / Incorporated in Minneapolis

0.0%
15.0%
Zip Codes with the Highest Percentage of Self-Employed / Incorporated in Minneapolis Map

Zip Codes with the Highest Percentage of Self-Employed / Incorporated in Minneapolis, MN

Zip Code % Self-Employed / Incorporated vs State vs National
1.5540210.1%3.9%(+6.19)#433.8%(+6.29)#2,262
2.554248.8%3.9%(+4.90)#653.8%(+5.00)#3,001
3.554367.6%3.9%(+3.68)#1023.8%(+3.79)#4,066
4.554377.2%3.9%(+3.24)#1143.8%(+3.35)#4,549
5.554106.3%3.9%(+2.37)#1773.8%(+2.47)#5,819
6.554396.2%3.9%(+2.30)#1813.8%(+2.41)#5,930
7.554196.2%3.9%(+2.24)#1883.8%(+2.35)#6,031
8.554096.0%3.9%(+2.03)#2043.8%(+2.14)#6,432
9.554425.9%3.9%(+2.02)#2083.8%(+2.12)#6,460
10.554415.4%3.9%(+1.46)#2513.8%(+1.56)#7,633
11.554495.1%3.9%(+1.15)#2863.8%(+1.25)#8,395
12.554464.9%3.9%(+1.03)#2993.8%(+1.13)#8,735
13.554014.7%3.9%(+0.784)#3283.8%(+0.887)#9,477
14.554164.5%3.9%(+0.573)#3563.8%(+0.676)#10,126
15.554484.2%3.9%(+0.318)#3963.8%(+0.422)#11,038
16.554474.2%3.9%(+0.309)#3983.8%(+0.412)#11,083
17.554384.2%3.9%(+0.266)#4073.8%(+0.369)#11,213
18.554354.1%3.9%(+0.143)#4323.8%(+0.246)#11,673
19.554184.1%3.9%(+0.132)#4353.8%(+0.235)#11,715
20.554173.7%3.9%(-0.187)#4873.8%(-0.083)#13,055
21.554073.6%3.9%(-0.309)#5083.8%(-0.205)#13,562
22.554273.6%3.9%(-0.343)#5133.8%(-0.240)#13,692
23.554083.4%3.9%(-0.515)#5353.8%(-0.412)#14,466
24.554263.4%3.9%(-0.537)#5373.8%(-0.433)#14,566
25.554203.4%3.9%(-0.567)#5443.8%(-0.464)#14,716
26.554223.3%3.9%(-0.628)#5523.8%(-0.524)#14,991
27.554063.3%3.9%(-0.648)#5563.8%(-0.545)#15,078
28.554453.1%3.9%(-0.773)#5823.8%(-0.669)#15,660
29.554433.0%3.9%(-0.918)#6033.8%(-0.814)#16,385
30.554343.0%3.9%(-0.925)#6083.8%(-0.822)#16,429
31.554133.0%3.9%(-0.929)#6103.8%(-0.825)#16,446
32.554052.8%3.9%(-1.08)#6363.8%(-0.976)#17,185
33.554252.8%3.9%(-1.13)#6443.8%(-1.03)#17,434
34.554212.7%3.9%(-1.21)#6523.8%(-1.11)#17,832
35.554282.7%3.9%(-1.25)#6573.8%(-1.14)#18,024
36.554032.7%3.9%(-1.26)#6593.8%(-1.16)#18,086
37.554152.6%3.9%(-1.27)#6613.8%(-1.17)#18,177
38.554232.6%3.9%(-1.28)#6623.8%(-1.17)#18,188
39.554122.5%3.9%(-1.42)#6853.8%(-1.32)#18,909
40.554312.4%3.9%(-1.55)#7013.8%(-1.44)#19,513
41.554332.3%3.9%(-1.59)#7063.8%(-1.48)#19,678
42.554442.3%3.9%(-1.60)#7083.8%(-1.50)#19,771
43.554322.3%3.9%(-1.64)#7143.8%(-1.54)#19,960
44.554112.2%3.9%(-1.69)#7213.8%(-1.59)#20,223
45.554042.1%3.9%(-1.82)#7373.8%(-1.71)#20,856
46.554292.1%3.9%(-1.85)#7413.8%(-1.75)#21,035
47.554141.5%3.9%(-2.43)#7853.8%(-2.32)#23,502
48.554551.2%3.9%(-2.67)#7953.8%(-2.57)#24,439
49.554301.2%3.9%(-2.75)#7983.8%(-2.64)#24,736
50.554540.70%3.9%(-3.22)#8263.8%(-3.12)#26,070

Common Questions

What are the Top 10 Zip Codes with the Highest Percentage of Self-Employed / Incorporated in Minneapolis, MN?
Top 10 Zip Codes with the Highest Percentage of Self-Employed / Incorporated in Minneapolis, MN are:
#1
10.1%
#2
8.8%
#3
7.6%
#4
7.2%
#5
6.3%
#6
6.2%
#7
6.2%
#8
6.0%
#9
5.9%
#10
5.4%
What zip code has the Highest Percentage of Self-Employed / Incorporated in Minneapolis, MN?
55402 has the Highest Percentage of Self-Employed / Incorporated in Minneapolis, MN with 10.1%.
What is the Percentage of Self-Employed / Incorporated in Minneapolis, MN?
Percentage of Self-Employed / Incorporated in Minneapolis is 3.4%.
What is the Percentage of Self-Employed / Incorporated in Minnesota?
Percentage of Self-Employed / Incorporated in Minnesota is 3.9%.
What is the Percentage of Self-Employed / Incorporated in the United States?
Percentage of Self-Employed / Incorporated in the United States is 3.8%.