Zip Codes with the Highest Percentage of Population Employed in Firefighting & Prevention in Minneapolis, MN

RELATED REPORTS & OPTIONS

Firefighting & Prevention
Population
Families and Households
Female Fertility
Female Fertility (Unmarried)
Race (Community Size)
Race (Percentage)
Ancestry (Community Size)
AfghanAfricanAlaska NativeAlbanianAlsatianAmericanApacheArabArgentineanArmenianAssyrian / Chaldean / SyriacAustralianAustrianBahamianBangladeshiBarbadianBasqueBelgianBelizeanBhutaneseBlackfeetBolivianBrazilianBritishBritish West IndianBulgarianBurmeseCajunCambodianCanadianCape VerdeanCarpatho RusynCelticCentral AmericanCentral American IndianCherokeeCheyenneChickasawChileanChippewaChoctawColombianComancheCosta RicanCreeCreekCroatianCrowCubanCypriotCzechCzechoslovakianDanishDominicanDutchEastern EuropeanEcuadorianEgyptianEnglishEstonianEthiopianEuropeanFijianFilipinoFinnishFrenchFrench American IndianFrench CanadianGermanGerman RussianGhanaianGreekGuamanian / ChamorroGuatemalanGuyaneseHaitianHonduranHungarianIcelanderIndian (Asian)IndonesianInupiatIranianIraqiIrishIroquoisIsraeliItalianJamaicanJapaneseJordanianKenyanKoreanLaotianLatvianLebaneseLiberianLithuanianLuxembourgerMacedonianMalaysianMalteseMenomineeMexicanMexican American IndianMongolianMoroccanNative HawaiianNavajoNicaraguanNigerianNorthern EuropeanNorwegianOkinawanOsagePakistaniPalestinianPanamanianParaguayanPennsylvania GermanPeruvianPolishPortuguesePotawatomiPuerto RicanRomanianRussianSalvadoranSamoanScandinavianScotch-IrishScottishSenegaleseSerbianSierra LeoneanSiouxSlavicSlovakSloveneSomaliSouth AfricanSouth AmericanSouth American IndianSoviet UnionSpaniardSpanishSri LankanSubsaharan AfricanSudaneseSwedishSwissSyrianThaiTonganTrinidadian and TobagonianTurkishUgandanUkrainianUruguayanVenezuelanVietnameseWelshWest IndianYugoslavian
Ancestry (Percentage)
AfghanAfricanAlaska NativeAlbanianAlsatianAmericanApacheArabArgentineanArmenianAssyrian / Chaldean / SyriacAustralianAustrianBahamianBangladeshiBarbadianBasqueBelgianBelizeanBhutaneseBlackfeetBolivianBrazilianBritishBritish West IndianBulgarianBurmeseCajunCambodianCanadianCape VerdeanCarpatho RusynCelticCentral AmericanCentral American IndianCherokeeCheyenneChickasawChileanChippewaChoctawColombianComancheCosta RicanCreeCreekCroatianCrowCubanCypriotCzechCzechoslovakianDanishDominicanDutchEastern EuropeanEcuadorianEgyptianEnglishEstonianEthiopianEuropeanFijianFilipinoFinnishFrenchFrench American IndianFrench CanadianGermanGerman RussianGhanaianGreekGuamanian / ChamorroGuatemalanGuyaneseHaitianHonduranHungarianIcelanderIndian (Asian)IndonesianInupiatIranianIraqiIrishIroquoisIsraeliItalianJamaicanJapaneseJordanianKenyanKoreanLaotianLatvianLebaneseLiberianLithuanianLuxembourgerMacedonianMalaysianMalteseMenomineeMexicanMexican American IndianMongolianMoroccanNative HawaiianNavajoNicaraguanNigerianNorthern EuropeanNorwegianOkinawanOsagePakistaniPalestinianPanamanianParaguayanPennsylvania GermanPeruvianPolishPortuguesePotawatomiPuerto RicanRomanianRussianSalvadoranSamoanScandinavianScotch-IrishScottishSenegaleseSerbianSierra LeoneanSiouxSlavicSlovakSloveneSomaliSouth AfricanSouth AmericanSouth American IndianSoviet UnionSpaniardSpanishSri LankanSubsaharan AfricanSudaneseSwedishSwissSyrianThaiTonganTrinidadian and TobagonianTurkishUgandanUkrainianUruguayanVenezuelanVietnameseWelshWest IndianYugoslavian
Immigrant Origin (Total)
AfghanistanAfricaAlbaniaArgentinaAsiaAustraliaAustriaBahamasBangladeshBarbadosBelarusBelgiumBelizeBoliviaBosnia and HerzegovinaBrazilBulgariaBurma / MyanmarCabo VerdeCambodiaCameroonCanadaCaribbeanCentral AmericaChileChinaColombiaCongoCosta RicaCroatiaCubaCzechoslovakiaDenmarkDominican RepublicEastern AfricaEastern AsiaEastern EuropeEcuadorEgyptEl SalvadorEnglandEritreaEthiopiaEuropeFranceGermanyGhanaGreeceGuatemalaGuyanaHaitiHondurasHong KongHungaryIndiaIndonesiaIranIraqIrelandIsraelItalyJamaicaJapanJordanKazakhstanKenyaKoreaKuwaitLaosLatin AmericaLatviaLebanonLiberiaLithuaniaMalaysiaMexicoMicronesiaMiddle AfricaMoldovaMoroccoNepalNetherlandsNicaraguaNigeriaNorthern AfricaNorthern EuropeNorwayOceaniaPakistanPanamaPeruPhilippinesPolandRomaniaRussiaSaudi ArabiaScotlandSenegalSerbiaSierra LeoneSingaporeSomaliaSouth AfricaSouth AmericaSouth Central AsiaSouth Eastern AsiaSouthern EuropeSpainSri LankaSudanSwedenSwitzerlandSyriaTaiwanThailandTrinidad and TobagoTurkeyUgandaUkraineUruguayUzbekistanVenezuelaVietnamWestern AfricaWestern AsiaWestern EuropeYemenZaireZimbabwe
Immigrant Origin (Percentage)
AfghanistanAfricaAlbaniaArgentinaAsiaAustraliaAustriaBahamasBangladeshBarbadosBelarusBelgiumBelizeBoliviaBosnia and HerzegovinaBrazilBulgariaBurma / MyanmarCabo VerdeCambodiaCameroonCanadaCaribbeanCentral AmericaChileChinaColombiaCongoCosta RicaCroatiaCubaCzechoslovakiaDenmarkDominican RepublicEastern AfricaEastern AsiaEastern EuropeEcuadorEgyptEl SalvadorEnglandEritreaEthiopiaEuropeFranceGermanyGhanaGreeceGuatemalaGuyanaHaitiHondurasHong KongHungaryIndiaIndonesiaIranIraqIrelandIsraelItalyJamaicaJapanJordanKazakhstanKenyaKoreaKuwaitLaosLatin AmericaLatviaLebanonLiberiaLithuaniaMalaysiaMexicoMicronesiaMiddle AfricaMoldovaMoroccoNepalNetherlandsNicaraguaNigeriaNorthern AfricaNorthern EuropeNorwayOceaniaPakistanPanamaPeruPhilippinesPolandRomaniaRussiaSaudi ArabiaScotlandSenegalSerbiaSierra LeoneSingaporeSomaliaSouth AfricaSouth AmericaSouth Central AsiaSouth Eastern AsiaSouthern EuropeSpainSri LankaSudanSwedenSwitzerlandSyriaTaiwanThailandTrinidad and TobagoTurkeyUgandaUkraineUruguayUzbekistanVenezuelaVietnamWestern AfricaWestern AsiaWestern EuropeYemenZaireZimbabwe
Income
Income (Families)
Income (Households)
Poverty
Poverty (Families)
Unemployment
Employment Occupations
Employment Industries
Employer Class
Commute Time
Commute Means
School Enrollment
Education by Degree Field
Occupancy
Finances
Physical Characteristics
Minneapolis
Compare Zip Codes
Comparison Subject

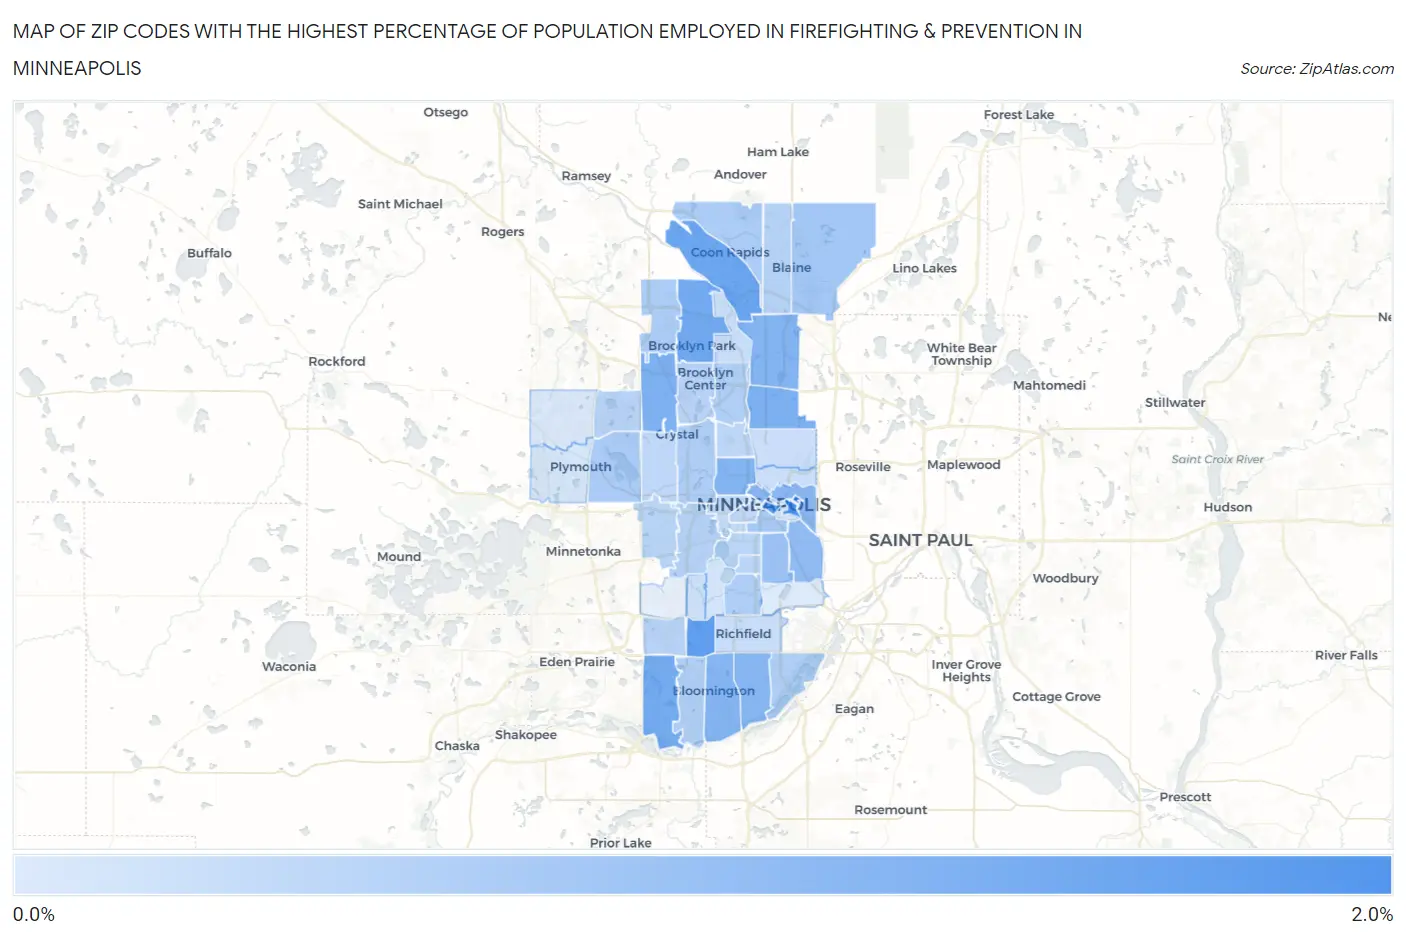
Map of Zip Codes with the Highest Percentage of Population Employed in Firefighting & Prevention in Minneapolis

0.0%
2.0%
Zip Codes with the Highest Percentage of Population Employed in Firefighting & Prevention in Minneapolis Map

Zip Codes with the Highest Percentage of Population Employed in Firefighting & Prevention in Minneapolis, MN

Zip Code % Employed vs State vs National
1.554552.0%0.66%(+1.31)#461.2%(+0.784)#4,628
2.554151.7%0.66%(+1.05)#591.2%(+0.517)#5,828
3.554351.6%0.66%(+0.983)#621.2%(+0.452)#6,175
4.554331.5%0.66%(+0.825)#801.2%(+0.295)#7,107
5.554431.4%0.66%(+0.754)#861.2%(+0.223)#7,579
6.554381.4%0.66%(+0.726)#891.2%(+0.195)#7,770
7.554211.3%0.66%(+0.638)#931.2%(+0.108)#8,393
8.554281.2%0.66%(+0.591)#1021.2%(+0.060)#8,763
9.554321.2%0.66%(+0.544)#1081.2%(+0.014)#9,141
10.554111.2%0.66%(+0.539)#1101.2%(+0.009)#9,188
11.554311.2%0.66%(+0.526)#1141.2%(-0.004)#9,305
12.554011.2%0.66%(+0.496)#1211.2%(-0.034)#9,603
13.554201.1%0.66%(+0.473)#1301.2%(-0.058)#9,845
14.554141.1%0.66%(+0.448)#1341.2%(-0.082)#10,078
15.554061.0%0.66%(+0.372)#1451.2%(-0.158)#10,809
16.554070.90%0.66%(+0.249)#1731.2%(-0.282)#12,121
17.554490.79%0.66%(+0.131)#2001.2%(-0.400)#13,374
18.554040.73%0.66%(+0.076)#2231.2%(-0.454)#13,968
19.554410.70%0.66%(+0.050)#2321.2%(-0.481)#14,283
20.554480.67%0.66%(+0.017)#2391.2%(-0.513)#14,629
21.554450.67%0.66%(+0.011)#2431.2%(-0.520)#14,715
22.554220.63%0.66%(-0.022)#2591.2%(-0.552)#15,072
23.554250.62%0.66%(-0.037)#2671.2%(-0.567)#15,215
24.554300.60%0.66%(-0.051)#2731.2%(-0.582)#15,379
25.554190.60%0.66%(-0.052)#2741.2%(-0.582)#15,383
26.554370.60%0.66%(-0.057)#2781.2%(-0.588)#15,439
27.554160.55%0.66%(-0.104)#2901.2%(-0.634)#15,949
28.554340.54%0.66%(-0.117)#2961.2%(-0.647)#16,086
29.554420.52%0.66%(-0.131)#3031.2%(-0.661)#16,269
30.554290.51%0.66%(-0.148)#3141.2%(-0.679)#16,471
31.554390.51%0.66%(-0.149)#3151.2%(-0.680)#16,479
32.554090.50%0.66%(-0.160)#3201.2%(-0.691)#16,600
33.554260.49%0.66%(-0.166)#3221.2%(-0.697)#16,681
34.554080.48%0.66%(-0.176)#3251.2%(-0.707)#16,790
35.554120.45%0.66%(-0.202)#3361.2%(-0.733)#17,064
36.554270.42%0.66%(-0.235)#3511.2%(-0.765)#17,409
37.554030.40%0.66%(-0.251)#3591.2%(-0.782)#17,611
38.554050.38%0.66%(-0.272)#3681.2%(-0.803)#17,850
39.554440.32%0.66%(-0.334)#4061.2%(-0.865)#18,536
40.554230.31%0.66%(-0.343)#4101.2%(-0.873)#18,634
41.554130.29%0.66%(-0.362)#4191.2%(-0.893)#18,827
42.554180.28%0.66%(-0.376)#4311.2%(-0.907)#18,966
43.554240.26%0.66%(-0.400)#4501.2%(-0.930)#19,190
44.554540.19%0.66%(-0.465)#4901.2%(-0.995)#19,752
45.554100.17%0.66%(-0.488)#5011.2%(-1.02)#19,915
46.554470.14%0.66%(-0.519)#5141.2%(-1.05)#20,119
47.554460.068%0.66%(-0.587)#5451.2%(-1.12)#20,451
48.554170.047%0.66%(-0.608)#5511.2%(-1.14)#20,515

Common Questions

What are the Top 10 Zip Codes with the Highest Percentage of Population Employed in Firefighting & Prevention in Minneapolis, MN?
Top 10 Zip Codes with the Highest Percentage of Population Employed in Firefighting & Prevention in Minneapolis, MN are:
#1
2.0%
#2
1.7%
#3
1.6%
#4
1.5%
#5
1.4%
#6
1.4%
#7
1.3%
#8
1.2%
#9
1.2%
#10
1.2%
What zip code has the Highest Percentage of Population Employed in Firefighting & Prevention in Minneapolis, MN?
55455 has the Highest Percentage of Population Employed in Firefighting & Prevention in Minneapolis, MN with 2.0%.
What is the Percentage of Population Employed in Firefighting & Prevention in Minneapolis, MN?
Percentage of Population Employed in Firefighting & Prevention in Minneapolis is 0.67%.
What is the Percentage of Population Employed in Firefighting & Prevention in Minnesota?
Percentage of Population Employed in Firefighting & Prevention in Minnesota is 0.66%.
What is the Percentage of Population Employed in Firefighting & Prevention in the United States?
Percentage of Population Employed in Firefighting & Prevention in the United States is 1.2%.