Zip Codes with the Highest Percentage of Population Employed in Food Preparation & Serving in Minneapolis, MN
RELATED REPORTS & OPTIONS
Food Preparation & Serving
Minneapolis
Compare Zip Codes
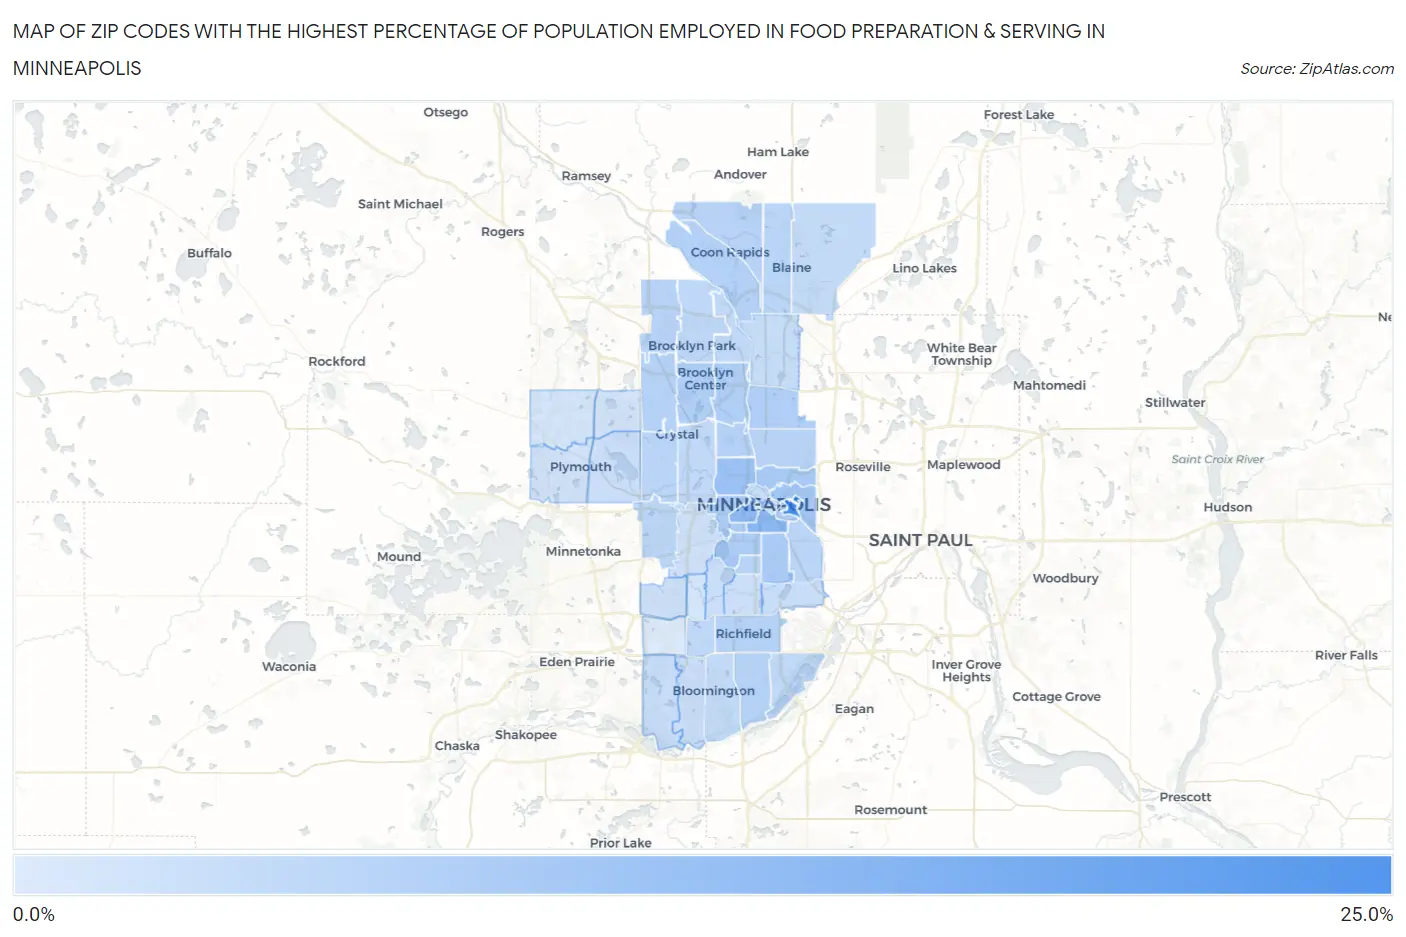
Map of Zip Codes with the Highest Percentage of Population Employed in Food Preparation & Serving in Minneapolis
0.64%
20.3%
Zip Codes with the Highest Percentage of Population Employed in Food Preparation & Serving in Minneapolis, MN
| Zip Code | % Employed | vs State | vs National | |
| 1. | 55455 | 20.3% | 4.7%(+15.6)#4 | 5.3%(+15.0)#486 |
| 2. | 55404 | 11.1% | 4.7%(+6.40)#24 | 5.3%(+5.84)#1,989 |
| 3. | 55403 | 10.5% | 4.7%(+5.79)#30 | 5.3%(+5.23)#2,321 |
| 4. | 55411 | 9.0% | 4.7%(+4.31)#54 | 5.3%(+3.76)#3,481 |
| 5. | 55414 | 7.9% | 4.7%(+3.18)#75 | 5.3%(+2.62)#4,877 |
| 6. | 55413 | 7.3% | 4.7%(+2.53)#103 | 5.3%(+1.98)#5,998 |
| 7. | 55454 | 7.1% | 4.7%(+2.37)#110 | 5.3%(+1.82)#6,335 |
| 8. | 55407 | 7.0% | 4.7%(+2.30)#112 | 5.3%(+1.74)#6,495 |
| 9. | 55408 | 6.5% | 4.7%(+1.80)#140 | 5.3%(+1.24)#7,796 |
| 10. | 55405 | 6.5% | 4.7%(+1.78)#142 | 5.3%(+1.22)#7,845 |
| 11. | 55429 | 6.1% | 4.7%(+1.41)#168 | 5.3%(+0.859)#8,894 |
| 12. | 55430 | 6.0% | 4.7%(+1.31)#177 | 5.3%(+0.756)#9,200 |
| 13. | 55421 | 6.0% | 4.7%(+1.27)#181 | 5.3%(+0.717)#9,334 |
| 14. | 55433 | 5.8% | 4.7%(+1.06)#198 | 5.3%(+0.501)#10,069 |
| 15. | 55412 | 5.7% | 4.7%(+0.983)#200 | 5.3%(+0.428)#10,278 |
| 16. | 55420 | 5.6% | 4.7%(+0.830)#220 | 5.3%(+0.276)#10,837 |
| 17. | 55428 | 5.5% | 4.7%(+0.803)#224 | 5.3%(+0.248)#10,946 |
| 18. | 55423 | 5.4% | 4.7%(+0.648)#241 | 5.3%(+0.093)#11,476 |
| 19. | 55418 | 5.2% | 4.7%(+0.496)#256 | 5.3%(-0.059)#12,034 |
| 20. | 55448 | 5.2% | 4.7%(+0.431)#261 | 5.3%(-0.124)#12,309 |
| 21. | 55409 | 5.1% | 4.7%(+0.417)#263 | 5.3%(-0.138)#12,369 |
| 22. | 55445 | 5.1% | 4.7%(+0.407)#265 | 5.3%(-0.147)#12,403 |
| 23. | 55427 | 5.0% | 4.7%(+0.239)#279 | 5.3%(-0.315)#13,056 |
| 24. | 55434 | 4.9% | 4.7%(+0.195)#284 | 5.3%(-0.359)#13,239 |
| 25. | 55406 | 4.9% | 4.7%(+0.152)#290 | 5.3%(-0.403)#13,426 |
| 26. | 55426 | 4.7% | 4.7%(-0.057)#322 | 5.3%(-0.612)#14,269 |
| 27. | 55443 | 4.4% | 4.7%(-0.338)#364 | 5.3%(-0.893)#15,449 |
| 28. | 55435 | 4.2% | 4.7%(-0.523)#397 | 5.3%(-1.08)#16,290 |
| 29. | 55422 | 4.1% | 4.7%(-0.614)#413 | 5.3%(-1.17)#16,628 |
| 30. | 55425 | 4.1% | 4.7%(-0.614)#414 | 5.3%(-1.17)#16,635 |
| 31. | 55444 | 3.9% | 4.7%(-0.808)#433 | 5.3%(-1.36)#17,430 |
| 32. | 55449 | 3.8% | 4.7%(-0.913)#453 | 5.3%(-1.47)#17,863 |
| 33. | 55431 | 3.6% | 4.7%(-1.13)#486 | 5.3%(-1.69)#18,775 |
| 34. | 55432 | 3.3% | 4.7%(-1.42)#538 | 5.3%(-1.97)#20,009 |
| 35. | 55417 | 3.0% | 4.7%(-1.70)#582 | 5.3%(-2.25)#21,125 |
| 36. | 55438 | 3.0% | 4.7%(-1.70)#583 | 5.3%(-2.25)#21,128 |
| 37. | 55401 | 3.0% | 4.7%(-1.78)#601 | 5.3%(-2.33)#21,442 |
| 38. | 55437 | 2.9% | 4.7%(-1.79)#602 | 5.3%(-2.34)#21,463 |
| 39. | 55441 | 2.9% | 4.7%(-1.82)#611 | 5.3%(-2.38)#21,610 |
| 40. | 55410 | 2.9% | 4.7%(-1.87)#614 | 5.3%(-2.42)#21,794 |
| 41. | 55436 | 2.7% | 4.7%(-2.05)#643 | 5.3%(-2.61)#22,488 |
| 42. | 55419 | 2.7% | 4.7%(-2.07)#646 | 5.3%(-2.63)#22,571 |
| 43. | 55416 | 2.3% | 4.7%(-2.40)#698 | 5.3%(-2.96)#23,685 |
| 44. | 55415 | 2.2% | 4.7%(-2.49)#712 | 5.3%(-3.05)#23,977 |
| 45. | 55447 | 2.1% | 4.7%(-2.60)#721 | 5.3%(-3.15)#24,300 |
| 46. | 55442 | 2.1% | 4.7%(-2.61)#723 | 5.3%(-3.16)#24,333 |
| 47. | 55424 | 1.8% | 4.7%(-2.94)#754 | 5.3%(-3.50)#25,286 |
| 48. | 55446 | 1.6% | 4.7%(-3.11)#772 | 5.3%(-3.67)#25,720 |
| 49. | 55439 | 0.64% | 4.7%(-4.09)#823 | 5.3%(-4.64)#27,528 |
1
Common Questions
What are the Top 10 Zip Codes with the Highest Percentage of Population Employed in Food Preparation & Serving in Minneapolis, MN?
Top 10 Zip Codes with the Highest Percentage of Population Employed in Food Preparation & Serving in Minneapolis, MN are:
What zip code has the Highest Percentage of Population Employed in Food Preparation & Serving in Minneapolis, MN?
55455 has the Highest Percentage of Population Employed in Food Preparation & Serving in Minneapolis, MN with 20.3%.
What is the Percentage of Population Employed in Food Preparation & Serving in Minneapolis, MN?
Percentage of Population Employed in Food Preparation & Serving in Minneapolis is 6.2%.
What is the Percentage of Population Employed in Food Preparation & Serving in Minnesota?
Percentage of Population Employed in Food Preparation & Serving in Minnesota is 4.7%.
What is the Percentage of Population Employed in Food Preparation & Serving in the United States?
Percentage of Population Employed in Food Preparation & Serving in the United States is 5.3%.