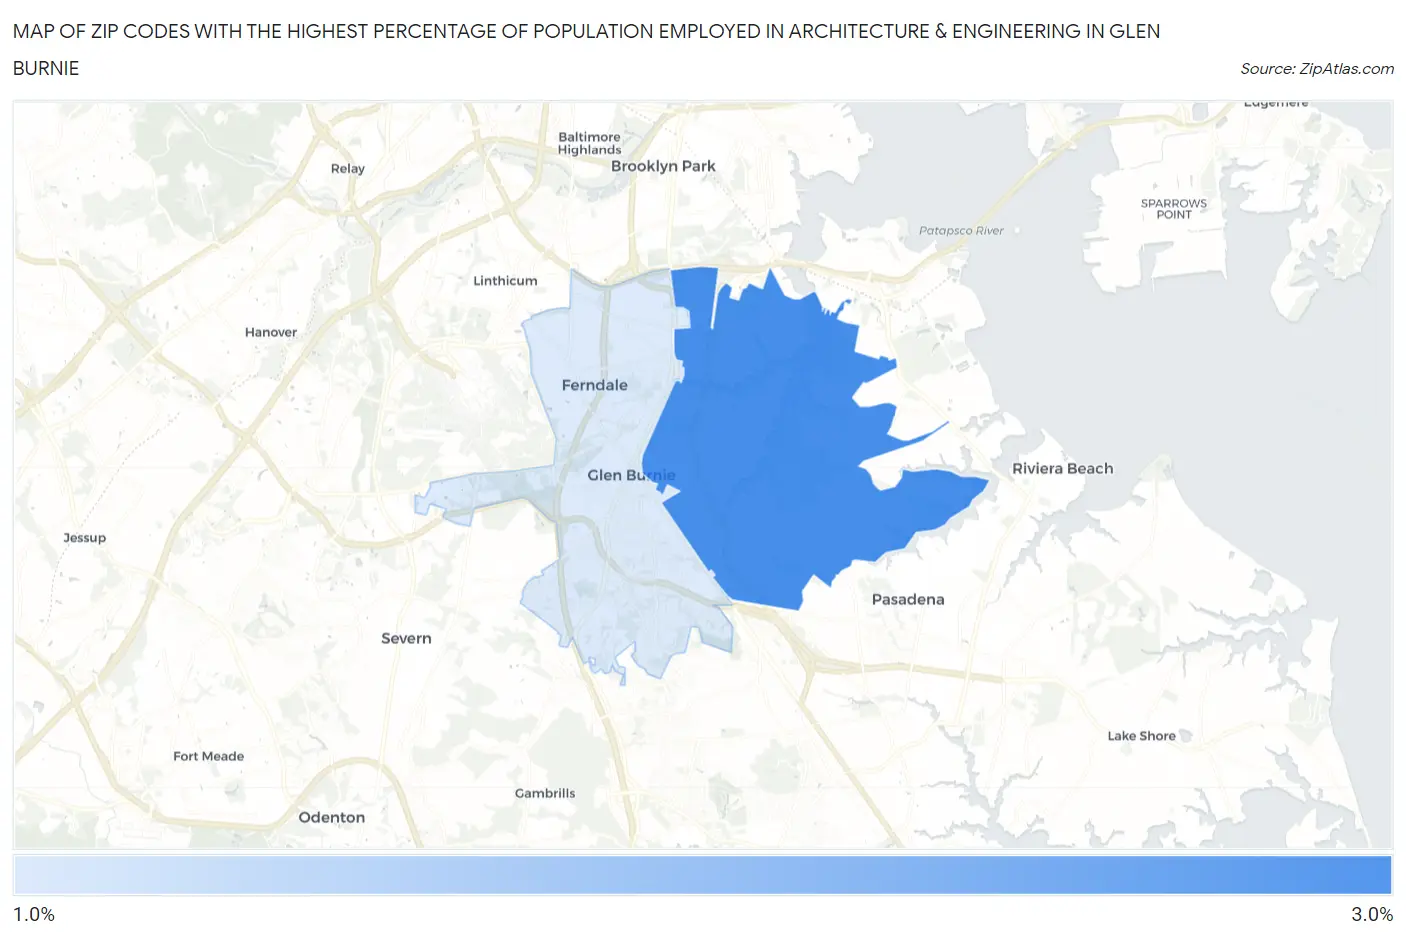
Zip Codes with the Highest Percentage of Population Employed in Architecture & Engineering in Glen Burnie, MD
RELATED REPORTS & OPTIONS
Architecture & Engineering
Glen Burnie
Compare Zip Codes
Map of Zip Codes with the Highest Percentage of Population Employed in Architecture & Engineering in Glen Burnie
1.6%
2.7%
Zip Codes with the Highest Percentage of Population Employed in Architecture & Engineering in Glen Burnie, MD
| Zip Code | % Employed | vs State | vs National | |
| 1. | 21060 | 2.7% | 2.4%(+0.303)#148 | 2.1%(+0.541)#6,205 |
| 2. | 21061 | 1.6% | 2.4%(-0.747)#250 | 2.1%(-0.509)#11,906 |
1
Common Questions
What are the Top Zip Codes with the Highest Percentage of Population Employed in Architecture & Engineering in Glen Burnie, MD?
Top Zip Codes with the Highest Percentage of Population Employed in Architecture & Engineering in Glen Burnie, MD are:
What zip code has the Highest Percentage of Population Employed in Architecture & Engineering in Glen Burnie, MD?
21060 has the Highest Percentage of Population Employed in Architecture & Engineering in Glen Burnie, MD with 2.7%.
What is the Percentage of Population Employed in Architecture & Engineering in Glen Burnie, MD?
Percentage of Population Employed in Architecture & Engineering in Glen Burnie is 2.0%.
What is the Percentage of Population Employed in Architecture & Engineering in Maryland?
Percentage of Population Employed in Architecture & Engineering in Maryland is 2.4%.
What is the Percentage of Population Employed in Architecture & Engineering in the United States?
Percentage of Population Employed in Architecture & Engineering in the United States is 2.1%.