Zip Codes with the Highest Percentage of Population Employed in Health Diagnosing & Treating in Glen Burnie, MD
RELATED REPORTS & OPTIONS
Health Diagnosing & Treating
Glen Burnie
Compare Zip Codes
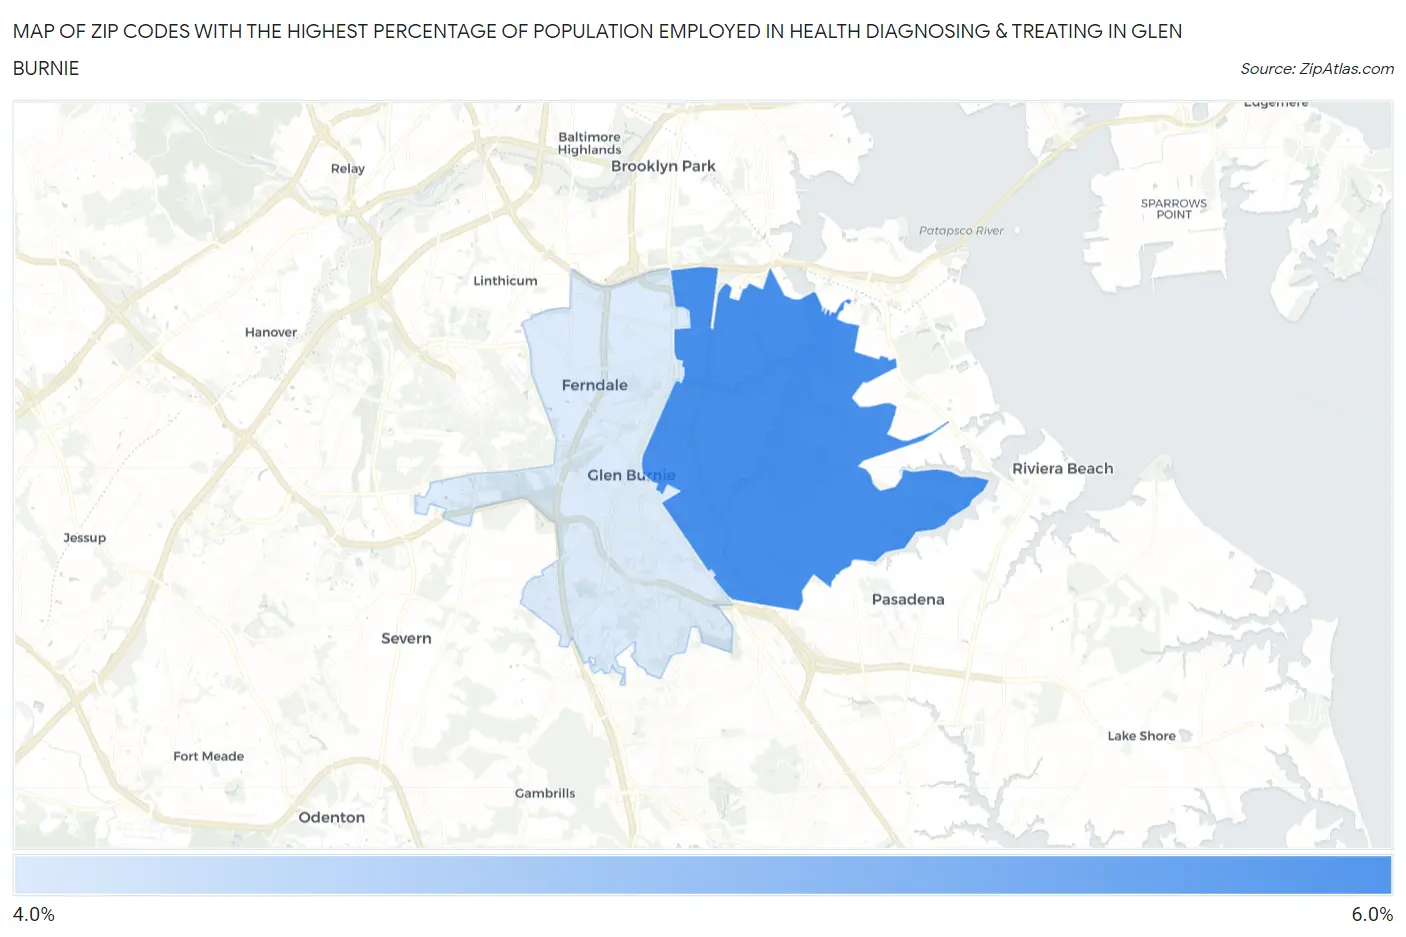
Map of Zip Codes with the Highest Percentage of Population Employed in Health Diagnosing & Treating in Glen Burnie
4.5%
5.5%
Zip Codes with the Highest Percentage of Population Employed in Health Diagnosing & Treating in Glen Burnie, MD
| Zip Code | % Employed | vs State | vs National | |
| 1. | 21060 | 5.5% | 6.2%(-0.671)#241 | 6.2%(-0.709)#15,655 |
| 2. | 21061 | 4.5% | 6.2%(-1.73)#285 | 6.2%(-1.77)#19,709 |
1
Common Questions
What are the Top Zip Codes with the Highest Percentage of Population Employed in Health Diagnosing & Treating in Glen Burnie, MD?
Top Zip Codes with the Highest Percentage of Population Employed in Health Diagnosing & Treating in Glen Burnie, MD are:
What zip code has the Highest Percentage of Population Employed in Health Diagnosing & Treating in Glen Burnie, MD?
21060 has the Highest Percentage of Population Employed in Health Diagnosing & Treating in Glen Burnie, MD with 5.5%.
What is the Percentage of Population Employed in Health Diagnosing & Treating in Glen Burnie, MD?
Percentage of Population Employed in Health Diagnosing & Treating in Glen Burnie is 4.0%.
What is the Percentage of Population Employed in Health Diagnosing & Treating in Maryland?
Percentage of Population Employed in Health Diagnosing & Treating in Maryland is 6.2%.
What is the Percentage of Population Employed in Health Diagnosing & Treating in the United States?
Percentage of Population Employed in Health Diagnosing & Treating in the United States is 6.2%.