Zip Codes with the Highest Percentage of Population with a Degree in Liberal Arts and History in Bowie, MD
RELATED REPORTS & OPTIONS
Liberal Arts and History
Bowie
Compare Zip Codes
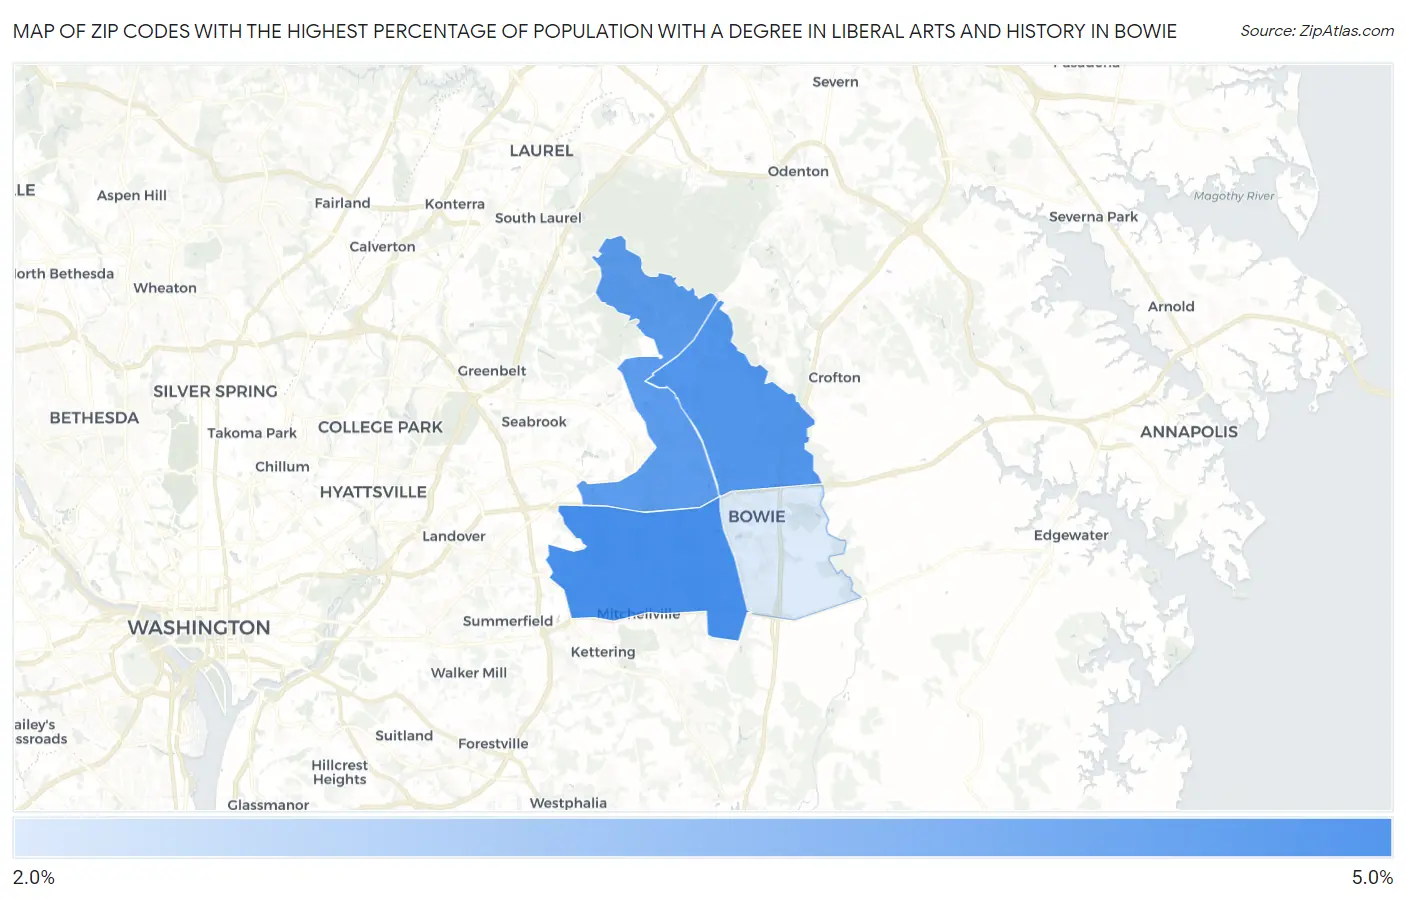
Map of Zip Codes with the Highest Percentage of Population with a Degree in Liberal Arts and History in Bowie
2.3%
4.1%
Zip Codes with the Highest Percentage of Population with a Degree in Liberal Arts and History in Bowie, MD
| Zip Code | % Graduates | vs State | vs National | |
| 1. | 20721 | 4.1% | 5.0%(-0.901)#241 | 4.9%(-0.739)#14,265 |
| 2. | 20715 | 4.0% | 5.0%(-1.03)#250 | 4.9%(-0.872)#14,767 |
| 3. | 20720 | 3.9% | 5.0%(-1.13)#258 | 4.9%(-0.964)#15,145 |
| 4. | 20716 | 2.3% | 5.0%(-2.70)#342 | 4.9%(-2.54)#20,457 |
1
Common Questions
What are the Top 3 Zip Codes with the Highest Percentage of Population with a Degree in Liberal Arts and History in Bowie, MD?
Top 3 Zip Codes with the Highest Percentage of Population with a Degree in Liberal Arts and History in Bowie, MD are:
What zip code has the Highest Percentage of Population with a Degree in Liberal Arts and History in Bowie, MD?
20721 has the Highest Percentage of Population with a Degree in Liberal Arts and History in Bowie, MD with 4.1%.
What is the Percentage of Population with a Degree in Liberal Arts and History in Bowie, MD?
Percentage of Population with a Degree in Liberal Arts and History in Bowie is 3.5%.
What is the Percentage of Population with a Degree in Liberal Arts and History in Maryland?
Percentage of Population with a Degree in Liberal Arts and History in Maryland is 5.0%.
What is the Percentage of Population with a Degree in Liberal Arts and History in the United States?
Percentage of Population with a Degree in Liberal Arts and History in the United States is 4.9%.