Zip Codes with the Highest Percentage of Population Employed in Business & Financial in Bowie, MD
RELATED REPORTS & OPTIONS
Business & Financial
Bowie
Compare Zip Codes
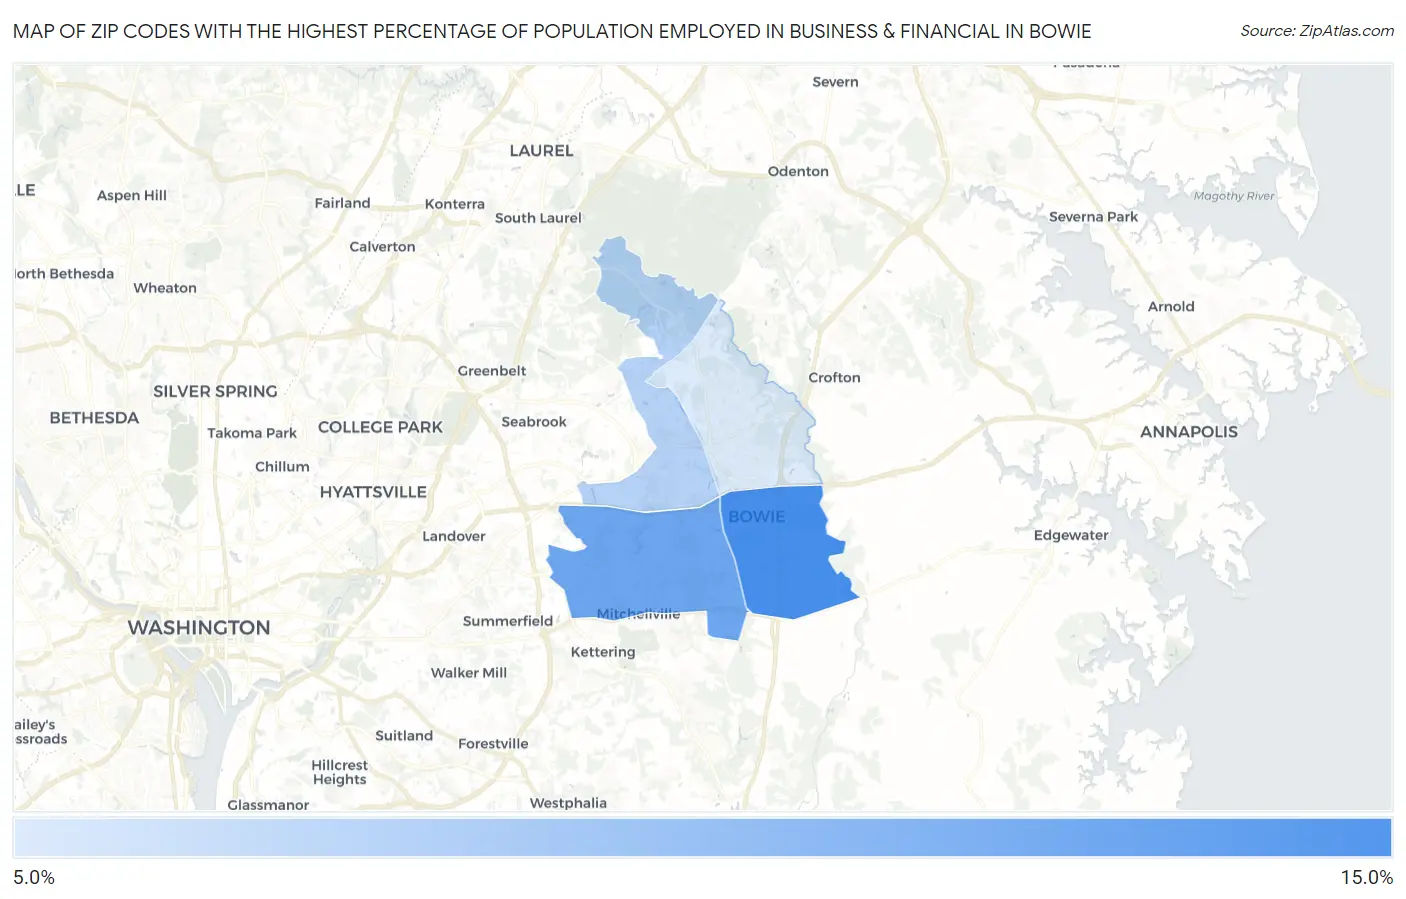
Map of Zip Codes with the Highest Percentage of Population Employed in Business & Financial in Bowie
10.0%
12.7%
Zip Codes with the Highest Percentage of Population Employed in Business & Financial in Bowie, MD
| Zip Code | % Employed | vs State | vs National | |
| 1. | 20716 | 12.7% | 7.3%(+5.36)#32 | 5.8%(+6.91)#1,015 |
| 2. | 20721 | 12.0% | 7.3%(+4.66)#41 | 5.8%(+6.20)#1,225 |
| 3. | 20720 | 10.7% | 7.3%(+3.41)#57 | 5.8%(+4.96)#1,783 |
| 4. | 20715 | 10.0% | 7.3%(+2.73)#69 | 5.8%(+4.28)#2,165 |
1
Common Questions
What are the Top 3 Zip Codes with the Highest Percentage of Population Employed in Business & Financial in Bowie, MD?
Top 3 Zip Codes with the Highest Percentage of Population Employed in Business & Financial in Bowie, MD are:
What zip code has the Highest Percentage of Population Employed in Business & Financial in Bowie, MD?
20716 has the Highest Percentage of Population Employed in Business & Financial in Bowie, MD with 12.7%.
What is the Percentage of Population Employed in Business & Financial in Bowie, MD?
Percentage of Population Employed in Business & Financial in Bowie is 11.3%.
What is the Percentage of Population Employed in Business & Financial in Maryland?
Percentage of Population Employed in Business & Financial in Maryland is 7.3%.
What is the Percentage of Population Employed in Business & Financial in the United States?
Percentage of Population Employed in Business & Financial in the United States is 5.8%.