Zip Codes with the Highest Percentage of Population Employed in Mining, Quarrying, & Extraction in Louisiana
RELATED REPORTS & OPTIONS
Mining, Quarrying, & Extraction
Louisiana
Compare Zip Codes
Map of Zip Codes with the Highest Percentage of Population Employed in Mining, Quarrying, & Extraction in Louisiana
0.0%
100.0%
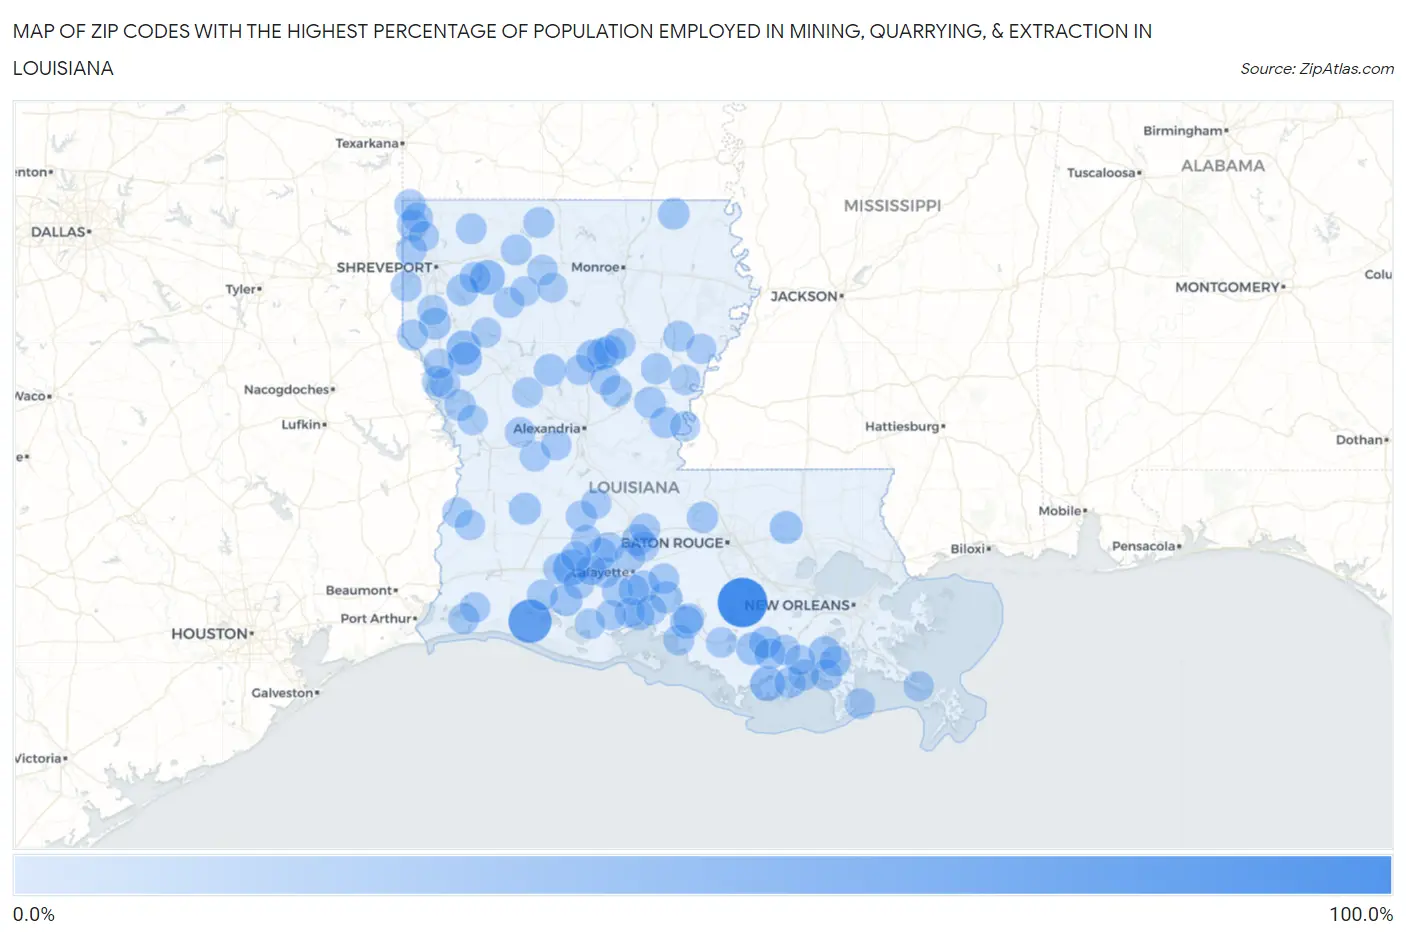
Zip Codes with the Highest Percentage of Population Employed in Mining, Quarrying, & Extraction in Louisiana
| Zip Code | % Employed | vs State | vs National | |
| 1. | 70391 | 100.0% | 2.4% (+97.6)#1 | 0.44% (+99.6)#5 |
| 2. | 70632 | 68.5% | 2.4% (+66.1)#2 | 0.44% (+68.0)#16 |
| 3. | 70537 | 33.3% | 2.4% (+31.0)#3 | 0.44% (+32.9)#99 |
| 4. | 71039 | 27.8% | 2.4% (+25.5)#4 | 0.44% (+27.4)#143 |
| 5. | 70397 | 27.6% | 2.4% (+25.3)#5 | 0.44% (+27.2)#146 |
| 6. | 71063 | 24.9% | 2.4% (+22.5)#6 | 0.44% (+24.5)#168 |
| 7. | 71065 | 22.5% | 2.4% (+20.2)#7 | 0.44% (+22.1)#203 |
| 8. | 71479 | 18.6% | 2.4% (+16.2)#8 | 0.44% (+18.1)#285 |
| 9. | 70744 | 18.5% | 2.4% (+16.1)#9 | 0.44% (+18.0)#294 |
| 10. | 70356 | 18.4% | 2.4% (+16.1)#10 | 0.44% (+18.0)#295 |
| 11. | 70373 | 18.0% | 2.4% (+15.6)#11 | 0.44% (+17.6)#315 |
| 12. | 70542 | 16.4% | 2.4% (+14.0)#12 | 0.44% (+15.9)#368 |
| 13. | 70514 | 16.1% | 2.4% (+13.8)#13 | 0.44% (+15.7)#378 |
| 14. | 71404 | 15.5% | 2.4% (+13.1)#14 | 0.44% (+15.1)#401 |
| 15. | 71465 | 14.7% | 2.4% (+12.3)#15 | 0.44% (+14.2)#447 |
| 16. | 71480 | 14.5% | 2.4% (+12.1)#16 | 0.44% (+14.1)#456 |
| 17. | 70637 | 14.5% | 2.4% (+12.1)#17 | 0.44% (+14.0)#460 |
| 18. | 71032 | 14.0% | 2.4% (+11.6)#18 | 0.44% (+13.5)#496 |
| 19. | 70563 | 14.0% | 2.4% (+11.6)#19 | 0.44% (+13.5)#497 |
| 20. | 70395 | 13.8% | 2.4% (+11.5)#20 | 0.44% (+13.4)#503 |
| 21. | 71051 | 13.5% | 2.4% (+11.2)#21 | 0.44% (+13.1)#521 |
| 22. | 70551 | 13.5% | 2.4% (+11.1)#22 | 0.44% (+13.1)#524 |
| 23. | 71223 | 12.7% | 2.4% (+10.3)#23 | 0.44% (+12.3)#574 |
| 24. | 71342 | 12.3% | 2.4% (+9.98)#24 | 0.44% (+11.9)#605 |
| 25. | 71343 | 12.2% | 2.4% (+9.88)#25 | 0.44% (+11.8)#614 |
| 26. | 70518 | 12.0% | 2.4% (+9.61)#26 | 0.44% (+11.5)#628 |
| 27. | 71449 | 11.8% | 2.4% (+9.42)#27 | 0.44% (+11.3)#643 |
| 28. | 71069 | 11.5% | 2.4% (+9.17)#28 | 0.44% (+11.1)#668 |
| 29. | 70749 | 11.5% | 2.4% (+9.16)#29 | 0.44% (+11.1)#669 |
| 30. | 71354 | 11.4% | 2.4% (+9.05)#30 | 0.44% (+11.0)#680 |
| 31. | 70354 | 11.3% | 2.4% (+8.97)#31 | 0.44% (+10.9)#688 |
| 32. | 70344 | 11.1% | 2.4% (+8.74)#32 | 0.44% (+10.7)#709 |
| 33. | 70360 | 11.0% | 2.4% (+8.61)#33 | 0.44% (+10.5)#715 |
| 34. | 70516 | 10.7% | 2.4% (+8.35)#34 | 0.44% (+10.3)#738 |
| 35. | 70631 | 10.3% | 2.4% (+7.90)#35 | 0.44% (+9.83)#785 |
| 36. | 71023 | 10.3% | 2.4% (+7.89)#36 | 0.44% (+9.82)#788 |
| 37. | 70549 | 10.1% | 2.4% (+7.71)#37 | 0.44% (+9.64)#807 |
| 38. | 70546 | 10.0% | 2.4% (+7.68)#38 | 0.44% (+9.61)#811 |
| 39. | 71340 | 9.9% | 2.4% (+7.56)#39 | 0.44% (+9.49)#822 |
| 40. | 71441 | 9.9% | 2.4% (+7.51)#40 | 0.44% (+9.44)#830 |
| 41. | 71336 | 9.8% | 2.4% (+7.46)#41 | 0.44% (+9.39)#841 |
| 42. | 71462 | 9.8% | 2.4% (+7.42)#42 | 0.44% (+9.35)#845 |
| 43. | 70377 | 9.7% | 2.4% (+7.36)#43 | 0.44% (+9.29)#851 |
| 44. | 70554 | 9.7% | 2.4% (+7.29)#44 | 0.44% (+9.22)#858 |
| 45. | 70345 | 9.7% | 2.4% (+7.28)#45 | 0.44% (+9.21)#861 |
| 46. | 71082 | 9.5% | 2.4% (+7.14)#46 | 0.44% (+9.07)#874 |
| 47. | 70538 | 9.5% | 2.4% (+7.10)#47 | 0.44% (+9.03)#881 |
| 48. | 71016 | 9.4% | 2.4% (+7.04)#48 | 0.44% (+8.97)#889 |
| 49. | 70528 | 9.3% | 2.4% (+6.91)#49 | 0.44% (+8.84)#912 |
| 50. | 70555 | 9.3% | 2.4% (+6.89)#50 | 0.44% (+8.82)#914 |
| 51. | 71007 | 9.2% | 2.4% (+6.79)#51 | 0.44% (+8.72)#927 |
| 52. | 71003 | 9.1% | 2.4% (+6.77)#52 | 0.44% (+8.70)#930 |
| 53. | 70592 | 9.1% | 2.4% (+6.69)#53 | 0.44% (+8.62)#936 |
| 54. | 71043 | 9.0% | 2.4% (+6.67)#54 | 0.44% (+8.60)#940 |
| 55. | 70523 | 9.0% | 2.4% (+6.67)#55 | 0.44% (+8.60)#943 |
| 56. | 71018 | 8.9% | 2.4% (+6.54)#56 | 0.44% (+8.47)#954 |
| 57. | 71049 | 8.9% | 2.4% (+6.53)#57 | 0.44% (+8.46)#956 |
| 58. | 71048 | 8.9% | 2.4% (+6.52)#58 | 0.44% (+8.45)#959 |
| 59. | 70582 | 8.8% | 2.4% (+6.43)#59 | 0.44% (+8.36)#977 |
| 60. | 71438 | 8.6% | 2.4% (+6.26)#60 | 0.44% (+8.19)#997 |
| 61. | 70578 | 8.6% | 2.4% (+6.25)#61 | 0.44% (+8.18)#1,001 |
| 62. | 71486 | 8.4% | 2.4% (+6.07)#62 | 0.44% (+8.00)#1,016 |
| 63. | 70358 | 8.3% | 2.4% (+5.90)#63 | 0.44% (+7.83)#1,047 |
| 64. | 70525 | 8.1% | 2.4% (+5.77)#64 | 0.44% (+7.70)#1,063 |
| 65. | 70645 | 8.0% | 2.4% (+5.65)#65 | 0.44% (+7.57)#1,081 |
| 66. | 71452 | 8.0% | 2.4% (+5.63)#66 | 0.44% (+7.56)#1,086 |
| 67. | 70559 | 7.7% | 2.4% (+5.32)#67 | 0.44% (+7.25)#1,129 |
| 68. | 70342 | 7.5% | 2.4% (+5.16)#68 | 0.44% (+7.09)#1,154 |
| 69. | 71060 | 7.5% | 2.4% (+5.09)#69 | 0.44% (+7.02)#1,168 |
| 70. | 70586 | 7.5% | 2.4% (+5.09)#70 | 0.44% (+7.01)#1,169 |
| 71. | 70526 | 7.4% | 2.4% (+5.06)#71 | 0.44% (+6.99)#1,171 |
| 72. | 71432 | 7.4% | 2.4% (+5.05)#72 | 0.44% (+6.98)#1,173 |
| 73. | 70512 | 7.4% | 2.4% (+5.00)#73 | 0.44% (+6.93)#1,182 |
| 74. | 71424 | 7.3% | 2.4% (+4.94)#74 | 0.44% (+6.87)#1,193 |
| 75. | 71474 | 7.3% | 2.4% (+4.92)#75 | 0.44% (+6.84)#1,197 |
| 76. | 70520 | 7.3% | 2.4% (+4.91)#76 | 0.44% (+6.84)#1,199 |
| 77. | 71371 | 7.3% | 2.4% (+4.91)#77 | 0.44% (+6.84)#1,200 |
| 78. | 71004 | 7.1% | 2.4% (+4.73)#78 | 0.44% (+6.66)#1,238 |
| 79. | 70535 | 7.1% | 2.4% (+4.71)#79 | 0.44% (+6.64)#1,242 |
| 80. | 70533 | 7.1% | 2.4% (+4.71)#80 | 0.44% (+6.63)#1,245 |
| 81. | 70364 | 7.1% | 2.4% (+4.69)#81 | 0.44% (+6.62)#1,248 |
| 82. | 70653 | 7.0% | 2.4% (+4.66)#82 | 0.44% (+6.59)#1,253 |
| 83. | 70510 | 7.0% | 2.4% (+4.65)#83 | 0.44% (+6.58)#1,254 |
| 84. | 70577 | 6.9% | 2.4% (+4.55)#84 | 0.44% (+6.48)#1,275 |
| 85. | 70548 | 6.9% | 2.4% (+4.51)#85 | 0.44% (+6.44)#1,289 |
| 86. | 71419 | 6.8% | 2.4% (+4.45)#86 | 0.44% (+6.38)#1,301 |
| 87. | 70660 | 6.7% | 2.4% (+4.35)#87 | 0.44% (+6.28)#1,320 |
| 88. | 70543 | 6.7% | 2.4% (+4.31)#88 | 0.44% (+6.24)#1,329 |
| 89. | 70560 | 6.7% | 2.4% (+4.29)#89 | 0.44% (+6.22)#1,331 |
| 90. | 70343 | 6.6% | 2.4% (+4.28)#90 | 0.44% (+6.21)#1,334 |
| 91. | 70041 | 6.6% | 2.4% (+4.25)#91 | 0.44% (+6.18)#1,339 |
| 92. | 71019 | 6.4% | 2.4% (+4.07)#92 | 0.44% (+5.99)#1,375 |
| 93. | 71275 | 6.4% | 2.4% (+3.99)#93 | 0.44% (+5.92)#1,389 |
| 94. | 71334 | 6.3% | 2.4% (+3.92)#94 | 0.44% (+5.85)#1,403 |
| 95. | 71030 | 6.2% | 2.4% (+3.82)#95 | 0.44% (+5.75)#1,427 |
| 96. | 71429 | 6.2% | 2.4% (+3.78)#96 | 0.44% (+5.71)#1,436 |
| 97. | 71375 | 6.1% | 2.4% (+3.72)#97 | 0.44% (+5.65)#1,450 |
| 98. | 71008 | 6.0% | 2.4% (+3.67)#98 | 0.44% (+5.60)#1,458 |
| 99. | 71268 | 6.0% | 2.4% (+3.66)#99 | 0.44% (+5.59)#1,459 |
| 100. | 71373 | 6.0% | 2.4% (+3.61)#100 | 0.44% (+5.54)#1,477 |
Common Questions
What are the Top 10 Zip Codes with the Highest Percentage of Population Employed in Mining, Quarrying, & Extraction in Louisiana?
Top 10 Zip Codes with the Highest Percentage of Population Employed in Mining, Quarrying, & Extraction in Louisiana are:
What zip code has the Highest Percentage of Population Employed in Mining, Quarrying, & Extraction in Louisiana?
70391 has the Highest Percentage of Population Employed in Mining, Quarrying, & Extraction in Louisiana with 100.0%.
What is the Percentage of Population Employed in Mining, Quarrying, & Extraction in the State of Louisiana?
Percentage of Population Employed in Mining, Quarrying, & Extraction in Louisiana is 2.4%.
What is the Percentage of Population Employed in Mining, Quarrying, & Extraction in the United States?
Percentage of Population Employed in Mining, Quarrying, & Extraction in the United States is 0.44%.