Zip Codes with the Highest Percentage of Population Employed in Accommodation & Food Services in Sioux City, IA
RELATED REPORTS & OPTIONS
Accommodation & Food Services
Sioux City
Compare Zip Codes
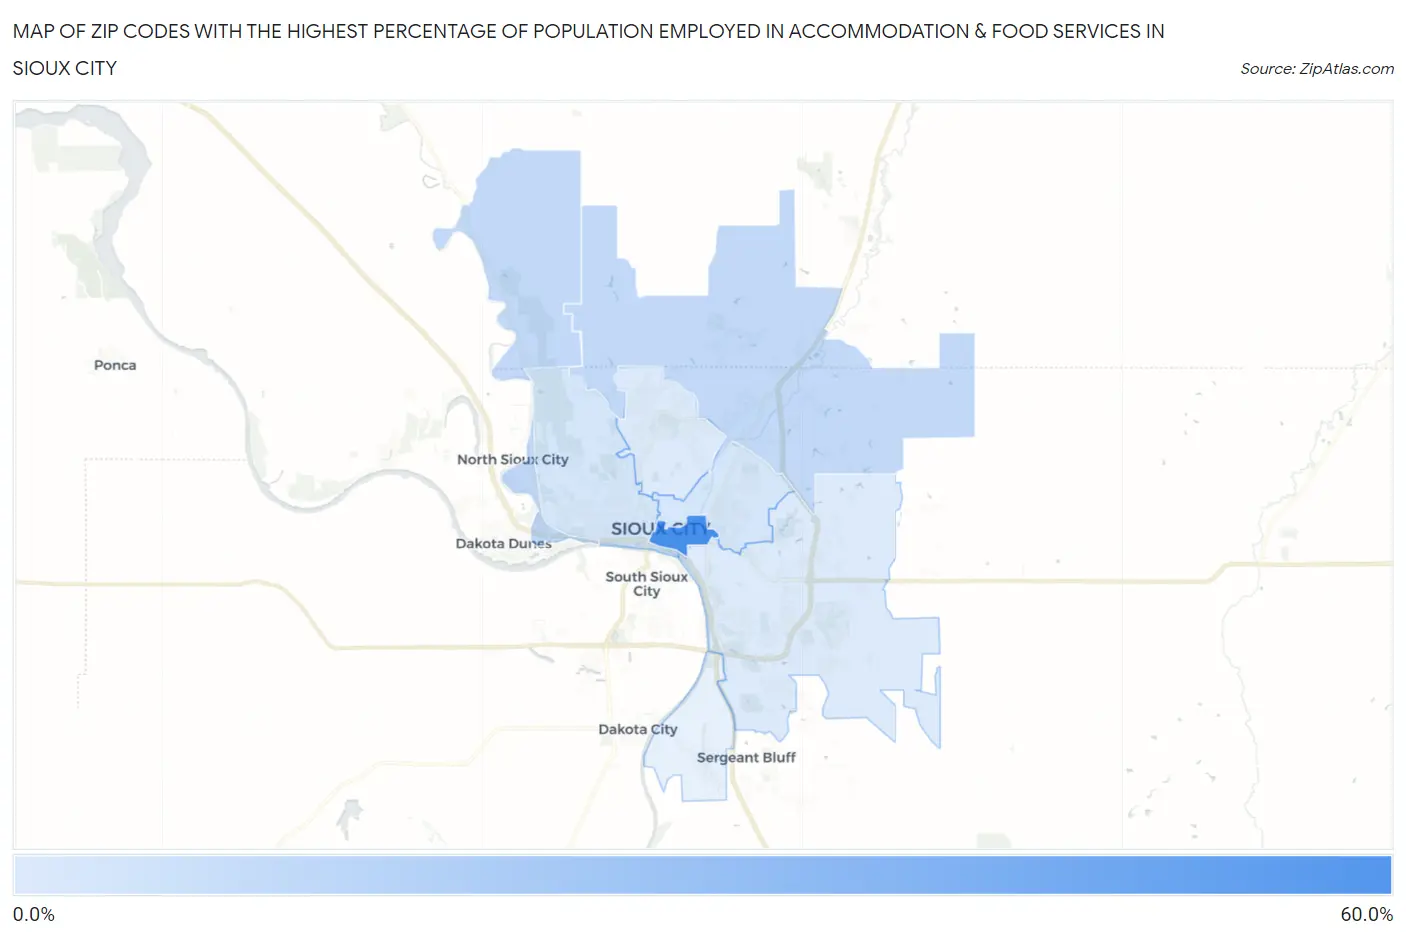
Map of Zip Codes with the Highest Percentage of Population Employed in Accommodation & Food Services in Sioux City
7.1%
52.4%
Zip Codes with the Highest Percentage of Population Employed in Accommodation & Food Services in Sioux City, IA
| Zip Code | % Employed | vs State | vs National | |
| 1. | 51101 | 52.4% | 5.5%(+46.9)#1 | 6.9%(+45.5)#82 |
| 2. | 51108 | 14.6% | 5.5%(+9.08)#15 | 6.9%(+7.69)#1,799 |
| 3. | 51109 | 14.1% | 5.5%(+8.65)#17 | 6.9%(+7.27)#1,920 |
| 4. | 51103 | 8.9% | 5.5%(+3.43)#66 | 6.9%(+2.05)#6,078 |
| 5. | 51105 | 8.7% | 5.5%(+3.20)#71 | 6.9%(+1.81)#6,486 |
| 6. | 51104 | 7.2% | 5.5%(+1.72)#111 | 6.9%(+0.338)#9,758 |
| 7. | 51106 | 7.1% | 5.5%(+1.63)#115 | 6.9%(+0.242)#10,000 |
1
Common Questions
What are the Top 5 Zip Codes with the Highest Percentage of Population Employed in Accommodation & Food Services in Sioux City, IA?
Top 5 Zip Codes with the Highest Percentage of Population Employed in Accommodation & Food Services in Sioux City, IA are:
What zip code has the Highest Percentage of Population Employed in Accommodation & Food Services in Sioux City, IA?
51101 has the Highest Percentage of Population Employed in Accommodation & Food Services in Sioux City, IA with 52.4%.
What is the Percentage of Population Employed in Accommodation & Food Services in Sioux City, IA?
Percentage of Population Employed in Accommodation & Food Services in Sioux City is 8.6%.
What is the Percentage of Population Employed in Accommodation & Food Services in Iowa?
Percentage of Population Employed in Accommodation & Food Services in Iowa is 5.5%.
What is the Percentage of Population Employed in Accommodation & Food Services in the United States?
Percentage of Population Employed in Accommodation & Food Services in the United States is 6.9%.