Zip Codes with the Highest Percentage of Population Employed in Accommodation & Food Services in Cedar Rapids, IA
RELATED REPORTS & OPTIONS
Accommodation & Food Services
Cedar Rapids
Compare Zip Codes
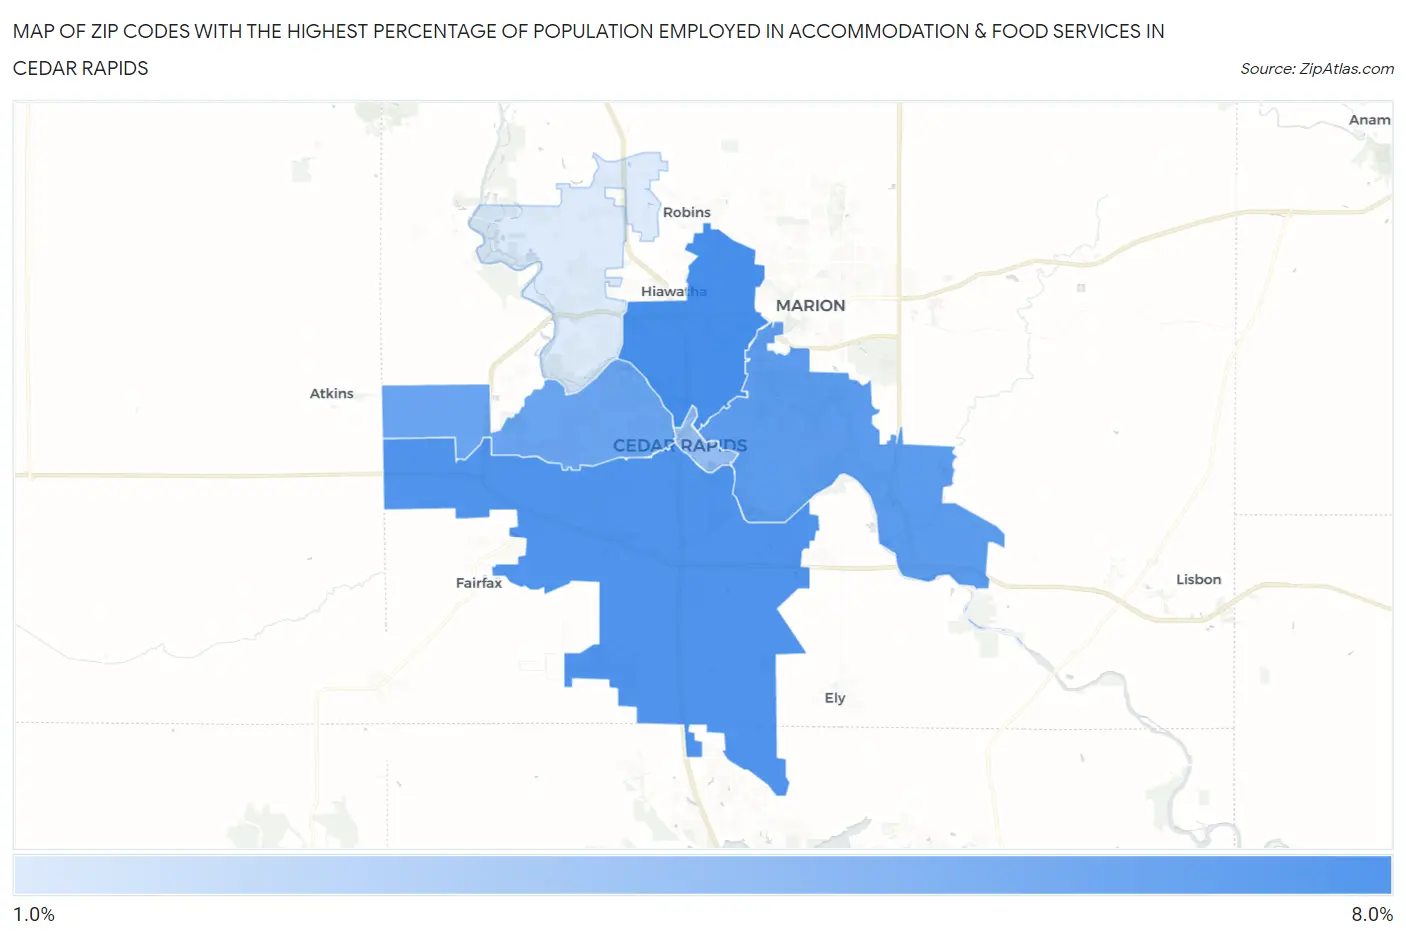
Map of Zip Codes with the Highest Percentage of Population Employed in Accommodation & Food Services in Cedar Rapids
2.0%
7.4%
Zip Codes with the Highest Percentage of Population Employed in Accommodation & Food Services in Cedar Rapids, IA
| Zip Code | % Employed | vs State | vs National | |
| 1. | 52402 | 7.4% | 5.5%(+1.92)#104 | 6.9%(+0.532)#9,216 |
| 2. | 52404 | 7.2% | 5.5%(+1.67)#112 | 6.9%(+0.285)#9,886 |
| 3. | 52403 | 6.7% | 5.5%(+1.20)#140 | 6.9%(-0.189)#11,220 |
| 4. | 52405 | 6.1% | 5.5%(+0.654)#164 | 6.9%(-0.732)#12,972 |
| 5. | 52401 | 4.6% | 5.5%(-0.861)#278 | 6.9%(-2.25)#18,046 |
| 6. | 52411 | 2.0% | 5.5%(-3.53)#600 | 6.9%(-4.92)#25,621 |
1
Common Questions
What are the Top 5 Zip Codes with the Highest Percentage of Population Employed in Accommodation & Food Services in Cedar Rapids, IA?
Top 5 Zip Codes with the Highest Percentage of Population Employed in Accommodation & Food Services in Cedar Rapids, IA are:
What zip code has the Highest Percentage of Population Employed in Accommodation & Food Services in Cedar Rapids, IA?
52402 has the Highest Percentage of Population Employed in Accommodation & Food Services in Cedar Rapids, IA with 7.4%.
What is the Percentage of Population Employed in Accommodation & Food Services in Cedar Rapids, IA?
Percentage of Population Employed in Accommodation & Food Services in Cedar Rapids is 6.9%.
What is the Percentage of Population Employed in Accommodation & Food Services in Iowa?
Percentage of Population Employed in Accommodation & Food Services in Iowa is 5.5%.
What is the Percentage of Population Employed in Accommodation & Food Services in the United States?
Percentage of Population Employed in Accommodation & Food Services in the United States is 6.9%.