Zip Codes with the Highest Percentage of Population Employed in Accommodation & Food Services in West Des Moines, IA
RELATED REPORTS & OPTIONS
Accommodation & Food Services
West Des Moines
Compare Zip Codes
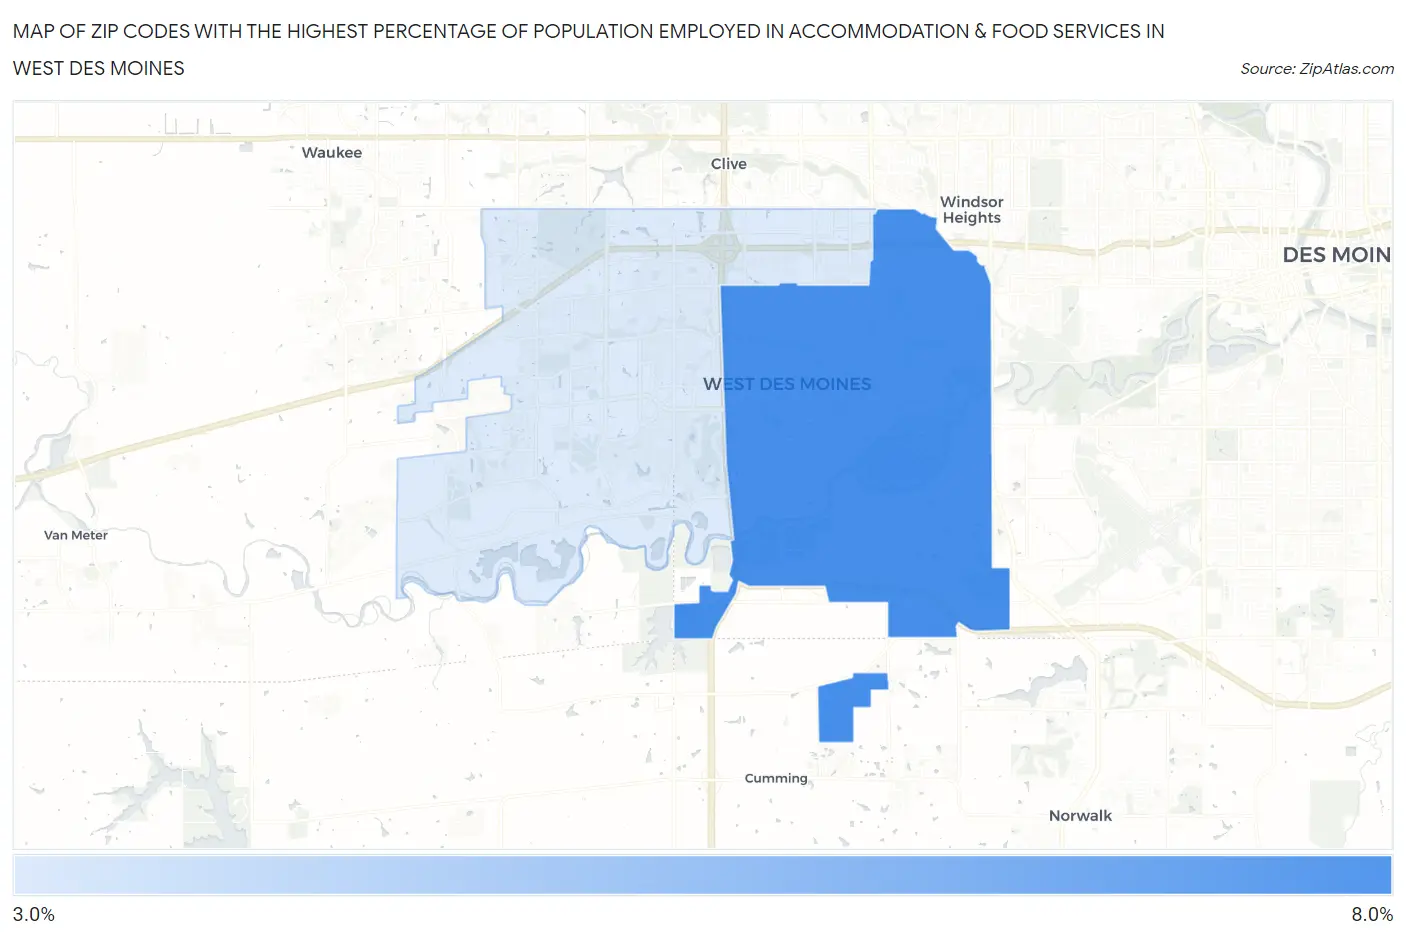
Map of Zip Codes with the Highest Percentage of Population Employed in Accommodation & Food Services in West Des Moines
3.8%
6.9%
Zip Codes with the Highest Percentage of Population Employed in Accommodation & Food Services in West Des Moines, IA
| Zip Code | % Employed | vs State | vs National | |
| 1. | 50265 | 6.9% | 5.5%(+1.39)#129 | 6.9%(+0.002)#10,631 |
| 2. | 50266 | 3.8% | 5.5%(-1.73)#368 | 6.9%(-3.11)#20,892 |
1
Common Questions
What are the Top Zip Codes with the Highest Percentage of Population Employed in Accommodation & Food Services in West Des Moines, IA?
Top Zip Codes with the Highest Percentage of Population Employed in Accommodation & Food Services in West Des Moines, IA are:
What zip code has the Highest Percentage of Population Employed in Accommodation & Food Services in West Des Moines, IA?
50265 has the Highest Percentage of Population Employed in Accommodation & Food Services in West Des Moines, IA with 6.9%.
What is the Percentage of Population Employed in Accommodation & Food Services in West Des Moines, IA?
Percentage of Population Employed in Accommodation & Food Services in West Des Moines is 5.2%.
What is the Percentage of Population Employed in Accommodation & Food Services in Iowa?
Percentage of Population Employed in Accommodation & Food Services in Iowa is 5.5%.
What is the Percentage of Population Employed in Accommodation & Food Services in the United States?
Percentage of Population Employed in Accommodation & Food Services in the United States is 6.9%.