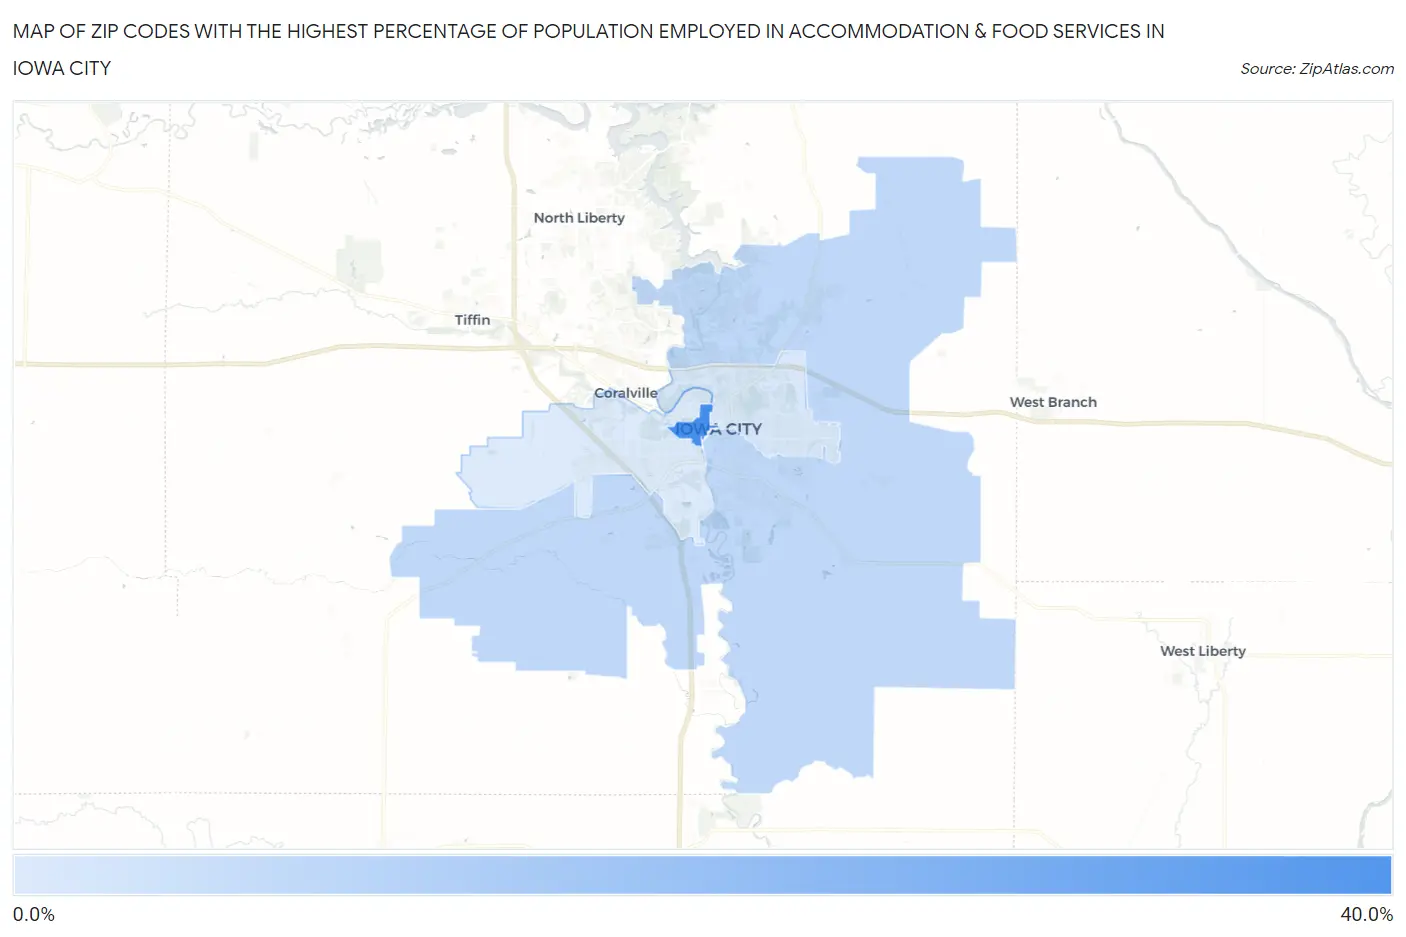
Zip Codes with the Highest Percentage of Population Employed in Accommodation & Food Services in Iowa City, IA
RELATED REPORTS & OPTIONS
Accommodation & Food Services
Iowa City
Compare Zip Codes
Map of Zip Codes with the Highest Percentage of Population Employed in Accommodation & Food Services in Iowa City
7.0%
30.1%
Zip Codes with the Highest Percentage of Population Employed in Accommodation & Food Services in Iowa City, IA
| Zip Code | % Employed | vs State | vs National | |
| 1. | 52242 | 30.1% | 5.5%(+24.6)#3 | 6.9%(+23.2)#329 |
| 2. | 52240 | 11.4% | 5.5%(+5.87)#30 | 6.9%(+4.48)#3,263 |
| 3. | 52245 | 7.5% | 5.5%(+2.02)#103 | 6.9%(+0.632)#8,966 |
| 4. | 52246 | 7.0% | 5.5%(+1.49)#123 | 6.9%(+0.102)#10,358 |
1
Common Questions
What are the Top 3 Zip Codes with the Highest Percentage of Population Employed in Accommodation & Food Services in Iowa City, IA?
Top 3 Zip Codes with the Highest Percentage of Population Employed in Accommodation & Food Services in Iowa City, IA are:
What zip code has the Highest Percentage of Population Employed in Accommodation & Food Services in Iowa City, IA?
52242 has the Highest Percentage of Population Employed in Accommodation & Food Services in Iowa City, IA with 30.1%.
What is the Percentage of Population Employed in Accommodation & Food Services in Iowa City, IA?
Percentage of Population Employed in Accommodation & Food Services in Iowa City is 10.2%.
What is the Percentage of Population Employed in Accommodation & Food Services in Iowa?
Percentage of Population Employed in Accommodation & Food Services in Iowa is 5.5%.
What is the Percentage of Population Employed in Accommodation & Food Services in the United States?
Percentage of Population Employed in Accommodation & Food Services in the United States is 6.9%.