Zip Codes with the Highest Percentage of Population Employed in Accommodation & Food Services in Davenport, IA
RELATED REPORTS & OPTIONS
Accommodation & Food Services
Davenport
Compare Zip Codes
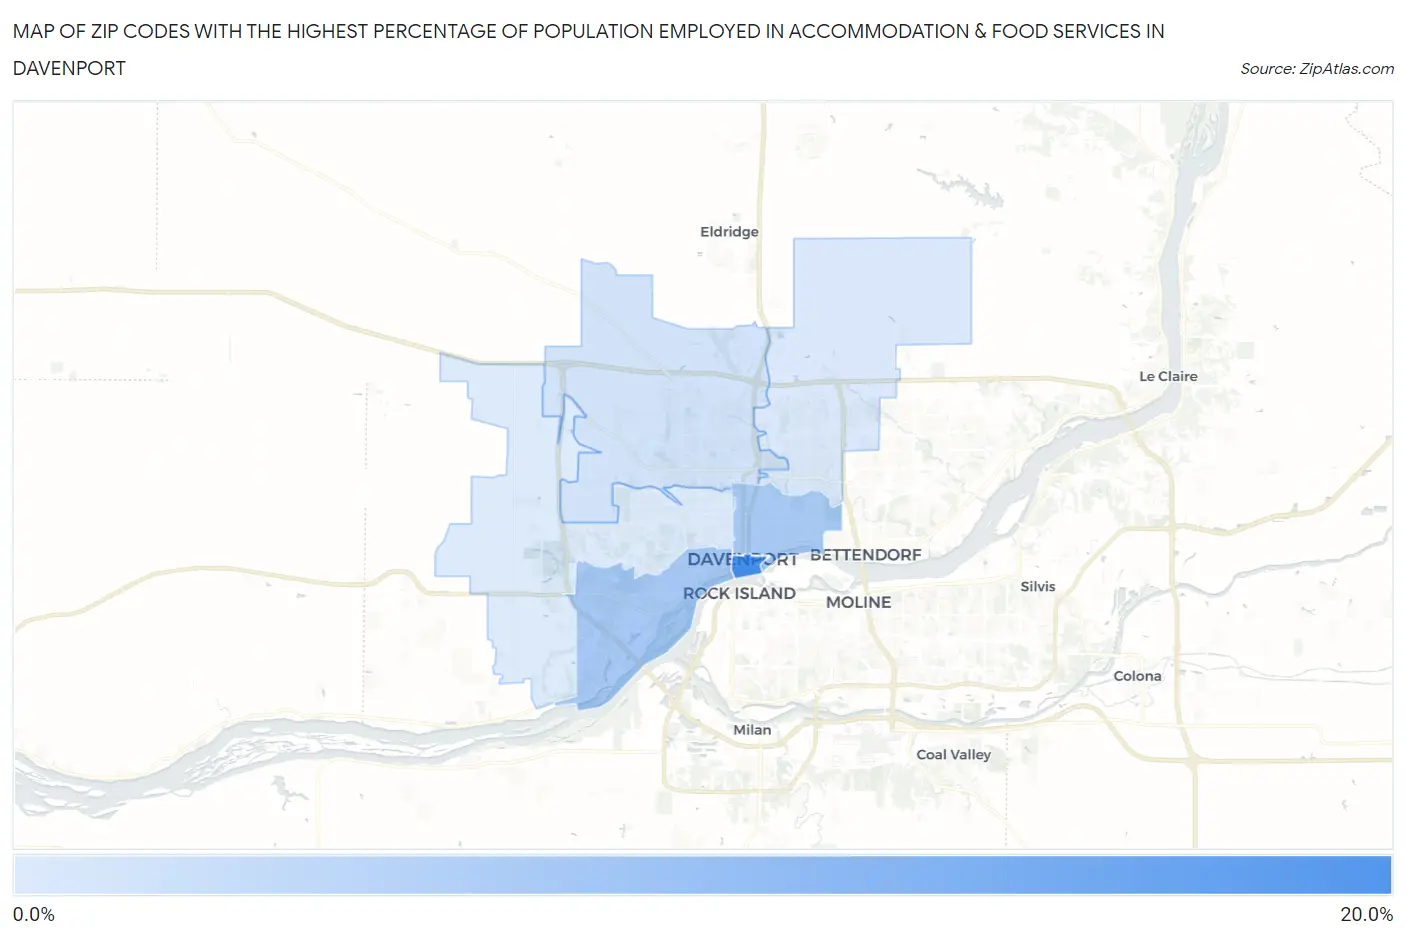
Map of Zip Codes with the Highest Percentage of Population Employed in Accommodation & Food Services in Davenport
6.8%
15.4%
Zip Codes with the Highest Percentage of Population Employed in Accommodation & Food Services in Davenport, IA
| Zip Code | % Employed | vs State | vs National | |
| 1. | 52801 | 15.4% | 5.5%(+9.93)#13 | 6.9%(+8.54)#1,571 |
| 2. | 52802 | 9.8% | 5.5%(+4.34)#45 | 6.9%(+2.95)#4,739 |
| 3. | 52803 | 9.8% | 5.5%(+4.29)#47 | 6.9%(+2.90)#4,813 |
| 4. | 52806 | 7.4% | 5.5%(+1.91)#106 | 6.9%(+0.524)#9,244 |
| 5. | 52807 | 6.9% | 5.5%(+1.41)#126 | 6.9%(+0.025)#10,581 |
| 6. | 52804 | 6.8% | 5.5%(+1.29)#137 | 6.9%(-0.101)#10,951 |
1
Common Questions
What are the Top 5 Zip Codes with the Highest Percentage of Population Employed in Accommodation & Food Services in Davenport, IA?
Top 5 Zip Codes with the Highest Percentage of Population Employed in Accommodation & Food Services in Davenport, IA are:
What zip code has the Highest Percentage of Population Employed in Accommodation & Food Services in Davenport, IA?
52801 has the Highest Percentage of Population Employed in Accommodation & Food Services in Davenport, IA with 15.4%.
What is the Percentage of Population Employed in Accommodation & Food Services in Davenport, IA?
Percentage of Population Employed in Accommodation & Food Services in Davenport is 8.2%.
What is the Percentage of Population Employed in Accommodation & Food Services in Iowa?
Percentage of Population Employed in Accommodation & Food Services in Iowa is 5.5%.
What is the Percentage of Population Employed in Accommodation & Food Services in the United States?
Percentage of Population Employed in Accommodation & Food Services in the United States is 6.9%.