Zip Codes with the Highest Percentage of Population Employed in Installation, Maintenance & Repair in Warner Robins, GA
RELATED REPORTS & OPTIONS
Installation, Maintenance & Repair
Warner Robins
Compare Zip Codes
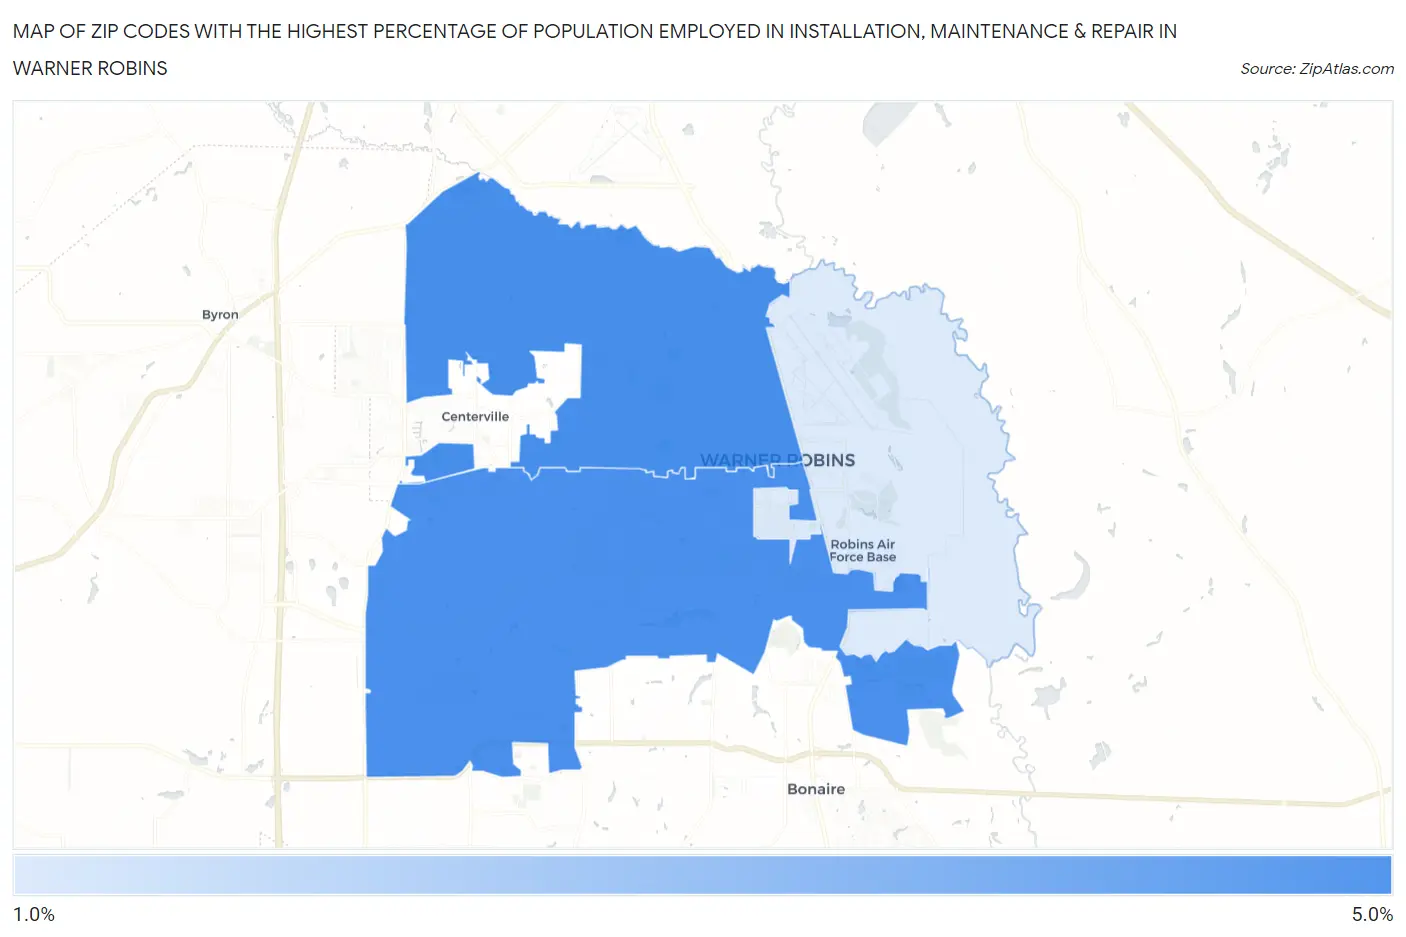
Map of Zip Codes with the Highest Percentage of Population Employed in Installation, Maintenance & Repair in Warner Robins
1.5%
4.9%
Zip Codes with the Highest Percentage of Population Employed in Installation, Maintenance & Repair in Warner Robins, GA
| Zip Code | % Employed | vs State | vs National | |
| 1. | 31093 | 4.9% | 3.4%(+1.53)#236 | 3.1%(+1.83)#9,064 |
| 2. | 31088 | 4.8% | 3.4%(+1.46)#244 | 3.1%(+1.76)#9,269 |
| 3. | 31098 | 1.5% | 3.4%(-1.88)#577 | 3.1%(-1.58)#24,215 |
1
Common Questions
What are the Top Zip Codes with the Highest Percentage of Population Employed in Installation, Maintenance & Repair in Warner Robins, GA?
Top Zip Codes with the Highest Percentage of Population Employed in Installation, Maintenance & Repair in Warner Robins, GA are:
What zip code has the Highest Percentage of Population Employed in Installation, Maintenance & Repair in Warner Robins, GA?
31093 has the Highest Percentage of Population Employed in Installation, Maintenance & Repair in Warner Robins, GA with 4.9%.
What is the Percentage of Population Employed in Installation, Maintenance & Repair in Warner Robins, GA?
Percentage of Population Employed in Installation, Maintenance & Repair in Warner Robins is 4.4%.
What is the Percentage of Population Employed in Installation, Maintenance & Repair in Georgia?
Percentage of Population Employed in Installation, Maintenance & Repair in Georgia is 3.4%.
What is the Percentage of Population Employed in Installation, Maintenance & Repair in the United States?
Percentage of Population Employed in Installation, Maintenance & Repair in the United States is 3.1%.