Zip Codes with the Highest Percentage of Private Company Employees in Warner Robins, GA
RELATED REPORTS & OPTIONS
Private Company Employees
Warner Robins
Compare Zip Codes
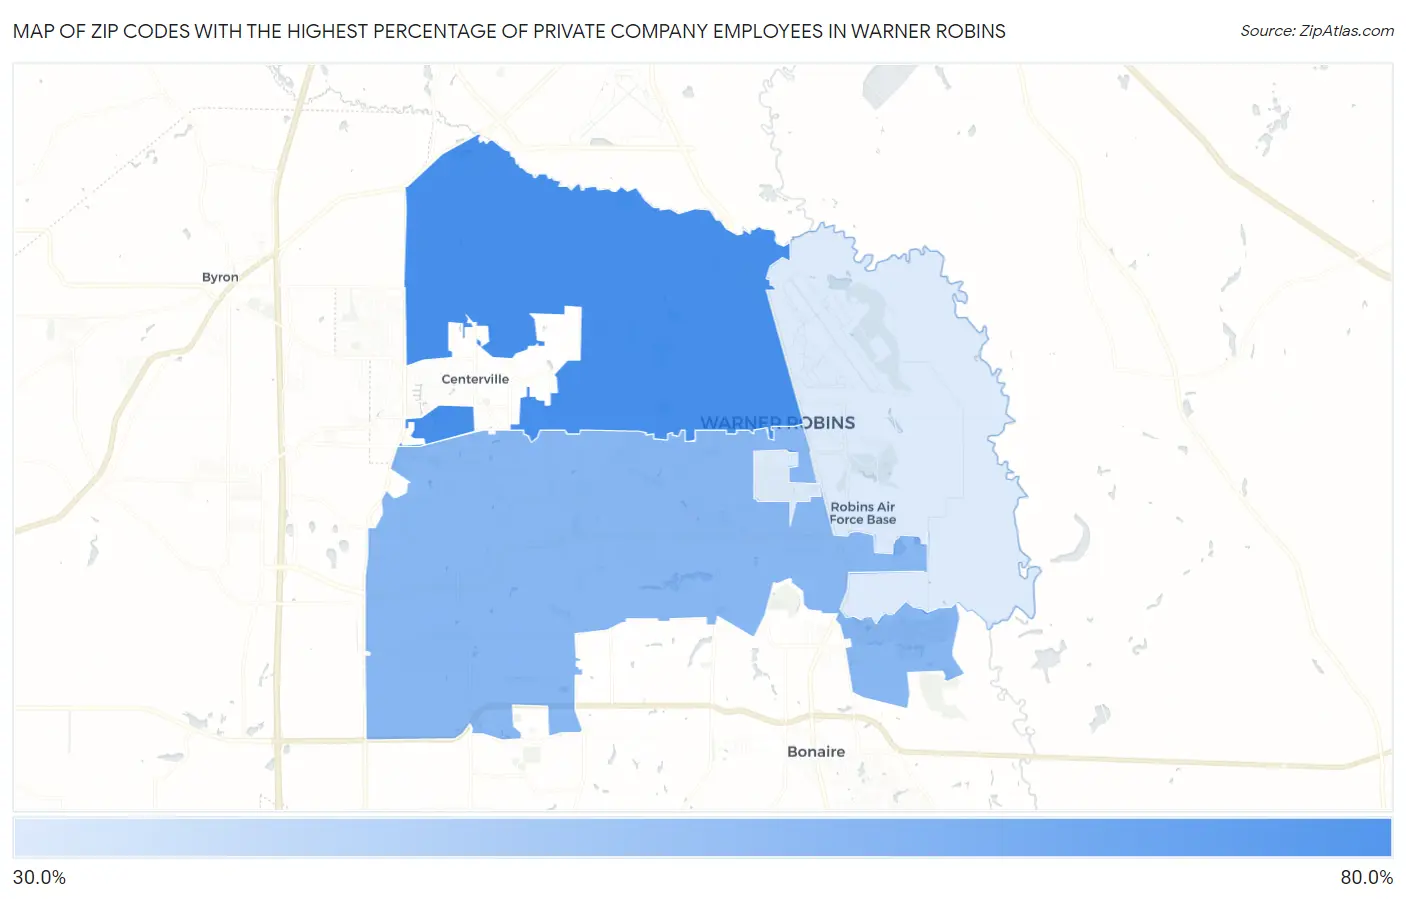
Map of Zip Codes with the Highest Percentage of Private Company Employees in Warner Robins
35.7%
70.9%
Zip Codes with the Highest Percentage of Private Company Employees in Warner Robins, GA
| Zip Code | % Private Company Employees | vs State | vs National | |
| 1. | 31093 | 70.9% | 68.7%(+2.20)#251 | 66.9%(+3.99)#9,202 |
| 2. | 31088 | 54.7% | 68.7%(-14.0)#653 | 66.9%(-12.2)#26,345 |
| 3. | 31098 | 35.7% | 68.7%(-33.0)#709 | 66.9%(-31.2)#31,164 |
1
Common Questions
What are the Top Zip Codes with the Highest Percentage of Private Company Employees in Warner Robins, GA?
Top Zip Codes with the Highest Percentage of Private Company Employees in Warner Robins, GA are:
What zip code has the Highest Percentage of Private Company Employees in Warner Robins, GA?
31093 has the Highest Percentage of Private Company Employees in Warner Robins, GA with 70.9%.
What is the Percentage of Private Company Employees in Warner Robins, GA?
Percentage of Private Company Employees in Warner Robins is 59.9%.
What is the Percentage of Private Company Employees in Georgia?
Percentage of Private Company Employees in Georgia is 68.7%.
What is the Percentage of Private Company Employees in the United States?
Percentage of Private Company Employees in the United States is 66.9%.