Tlingit-Haida vs Albanian Disability Age Over 75
COMPARE
Tlingit-Haida
Albanian
Disability Age Over 75
Disability Age Over 75 Comparison
Tlingit-Haida
Albanians
50.6%
DISABILITY AGE OVER 75
0.0/ 100
METRIC RATING
310th/ 347
METRIC RANK
46.3%
DISABILITY AGE OVER 75
98.1/ 100
METRIC RATING
94th/ 347
METRIC RANK
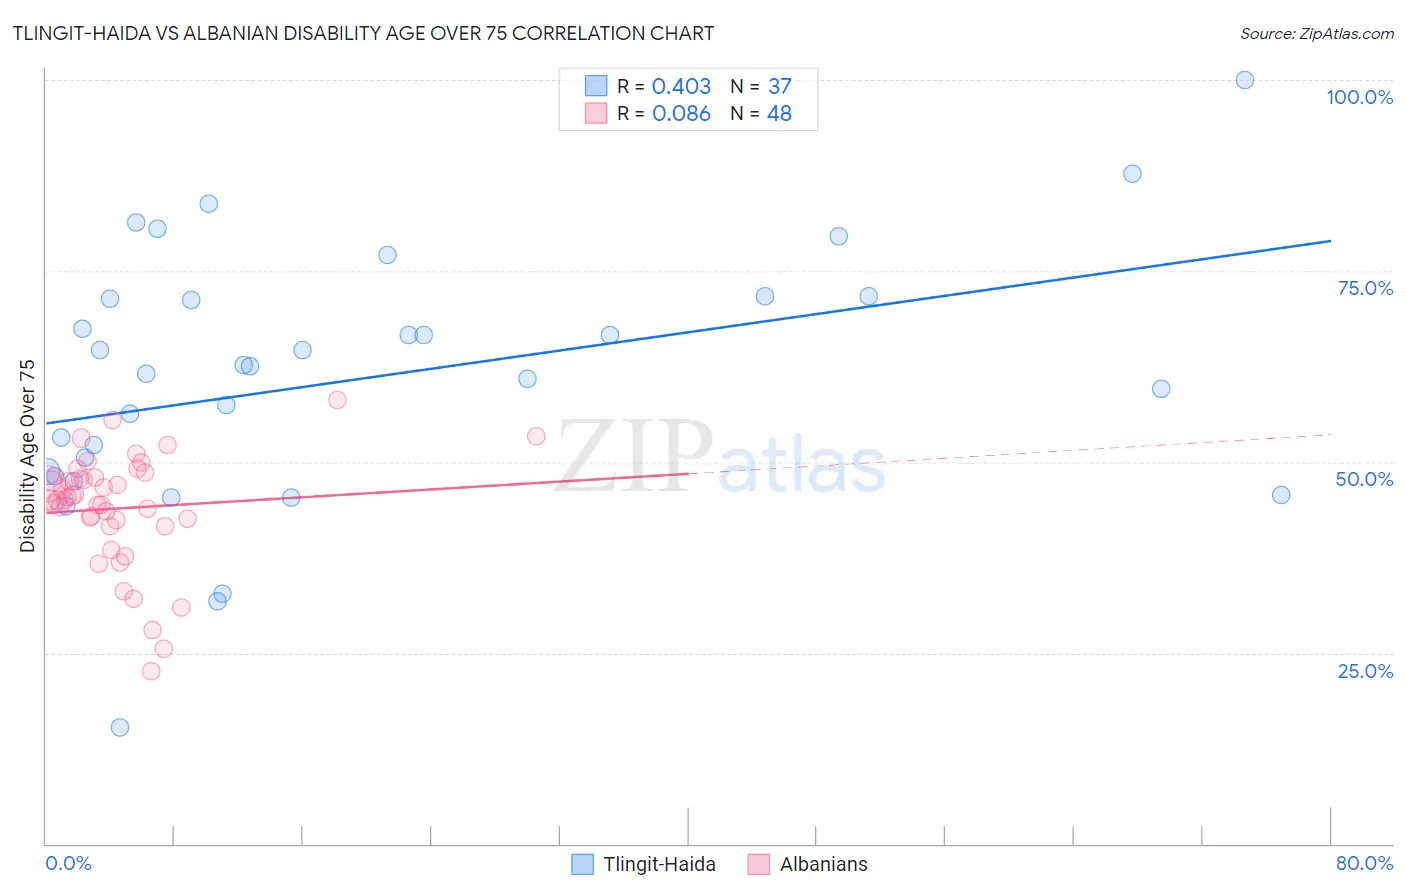
Tlingit-Haida vs Albanian Disability Age Over 75 Correlation Chart
The statistical analysis conducted on geographies consisting of 60,768,842 people shows a moderate positive correlation between the proportion of Tlingit-Haida and percentage of population with a disability over the age of 75 in the United States with a correlation coefficient (R) of 0.403 and weighted average of 50.6%. Similarly, the statistical analysis conducted on geographies consisting of 193,034,133 people shows a slight positive correlation between the proportion of Albanians and percentage of population with a disability over the age of 75 in the United States with a correlation coefficient (R) of 0.086 and weighted average of 46.3%, a difference of 9.3%.
Disability Age Over 75 Correlation Summary
| Measurement | Tlingit-Haida | Albanian |
| Minimum | 15.2% | 22.6% |
| Maximum | 100.0% | 58.2% |
| Range | 84.8% | 35.6% |
| Mean | 60.9% | 43.9% |
| Median | 62.5% | 45.0% |
| Interquartile 25% (IQ1) | 48.4% | 42.0% |
| Interquartile 75% (IQ3) | 71.5% | 47.9% |
| Interquartile Range (IQR) | 23.0% | 5.9% |
| Standard Deviation (Sample) | 16.9% | 7.4% |
| Standard Deviation (Population) | 16.7% | 7.3% |
Similar Demographics by Disability Age Over 75
Demographics Similar to Tlingit-Haida by Disability Age Over 75
In terms of disability age over 75, the demographic groups most similar to Tlingit-Haida are Hispanic or Latino (50.6%, a difference of 0.040%), Aleut (50.6%, a difference of 0.040%), Immigrants from Fiji (50.6%, a difference of 0.070%), Cajun (50.7%, a difference of 0.10%), and Immigrants from Central America (50.5%, a difference of 0.12%).
| Demographics | Rating | Rank | Disability Age Over 75 |
| Japanese | 0.0 /100 | #303 | Tragic 50.2% |
| Immigrants | Dominican Republic | 0.0 /100 | #304 | Tragic 50.3% |
| Central American Indians | 0.0 /100 | #305 | Tragic 50.5% |
| Immigrants | Central America | 0.0 /100 | #306 | Tragic 50.5% |
| Immigrants | Fiji | 0.0 /100 | #307 | Tragic 50.6% |
| Hispanics or Latinos | 0.0 /100 | #308 | Tragic 50.6% |
| Aleuts | 0.0 /100 | #309 | Tragic 50.6% |
| Tlingit-Haida | 0.0 /100 | #310 | Tragic 50.6% |
| Cajuns | 0.0 /100 | #311 | Tragic 50.7% |
| Cheyenne | 0.0 /100 | #312 | Tragic 50.9% |
| Immigrants | Azores | 0.0 /100 | #313 | Tragic 50.9% |
| Immigrants | Mexico | 0.0 /100 | #314 | Tragic 51.1% |
| Mexicans | 0.0 /100 | #315 | Tragic 51.1% |
| Chickasaw | 0.0 /100 | #316 | Tragic 51.2% |
| Yakama | 0.0 /100 | #317 | Tragic 51.3% |
Demographics Similar to Albanians by Disability Age Over 75
In terms of disability age over 75, the demographic groups most similar to Albanians are Ugandan (46.3%, a difference of 0.030%), Immigrants from Brazil (46.3%, a difference of 0.030%), Immigrants from China (46.3%, a difference of 0.030%), German (46.3%, a difference of 0.040%), and Finnish (46.3%, a difference of 0.050%).
| Demographics | Rating | Rank | Disability Age Over 75 |
| Danes | 98.6 /100 | #87 | Exceptional 46.2% |
| Uruguayans | 98.4 /100 | #88 | Exceptional 46.2% |
| Immigrants | Saudi Arabia | 98.4 /100 | #89 | Exceptional 46.3% |
| Northern Europeans | 98.3 /100 | #90 | Exceptional 46.3% |
| Immigrants | Egypt | 98.3 /100 | #91 | Exceptional 46.3% |
| Germans | 98.2 /100 | #92 | Exceptional 46.3% |
| Ugandans | 98.2 /100 | #93 | Exceptional 46.3% |
| Albanians | 98.1 /100 | #94 | Exceptional 46.3% |
| Immigrants | Brazil | 98.0 /100 | #95 | Exceptional 46.3% |
| Immigrants | China | 98.0 /100 | #96 | Exceptional 46.3% |
| Finns | 97.9 /100 | #97 | Exceptional 46.3% |
| Immigrants | Japan | 97.8 /100 | #98 | Exceptional 46.3% |
| Palestinians | 97.7 /100 | #99 | Exceptional 46.3% |
| Immigrants | Eastern Europe | 97.7 /100 | #100 | Exceptional 46.3% |
| Mongolians | 97.7 /100 | #101 | Exceptional 46.3% |