Tlingit-Haida vs Shoshone Disability Age Over 75
COMPARE
Tlingit-Haida
Shoshone
Disability Age Over 75
Disability Age Over 75 Comparison
Tlingit-Haida
Shoshone
50.6%
DISABILITY AGE OVER 75
0.0/ 100
METRIC RATING
310th/ 347
METRIC RANK
49.9%
DISABILITY AGE OVER 75
0.0/ 100
METRIC RATING
292nd/ 347
METRIC RANK
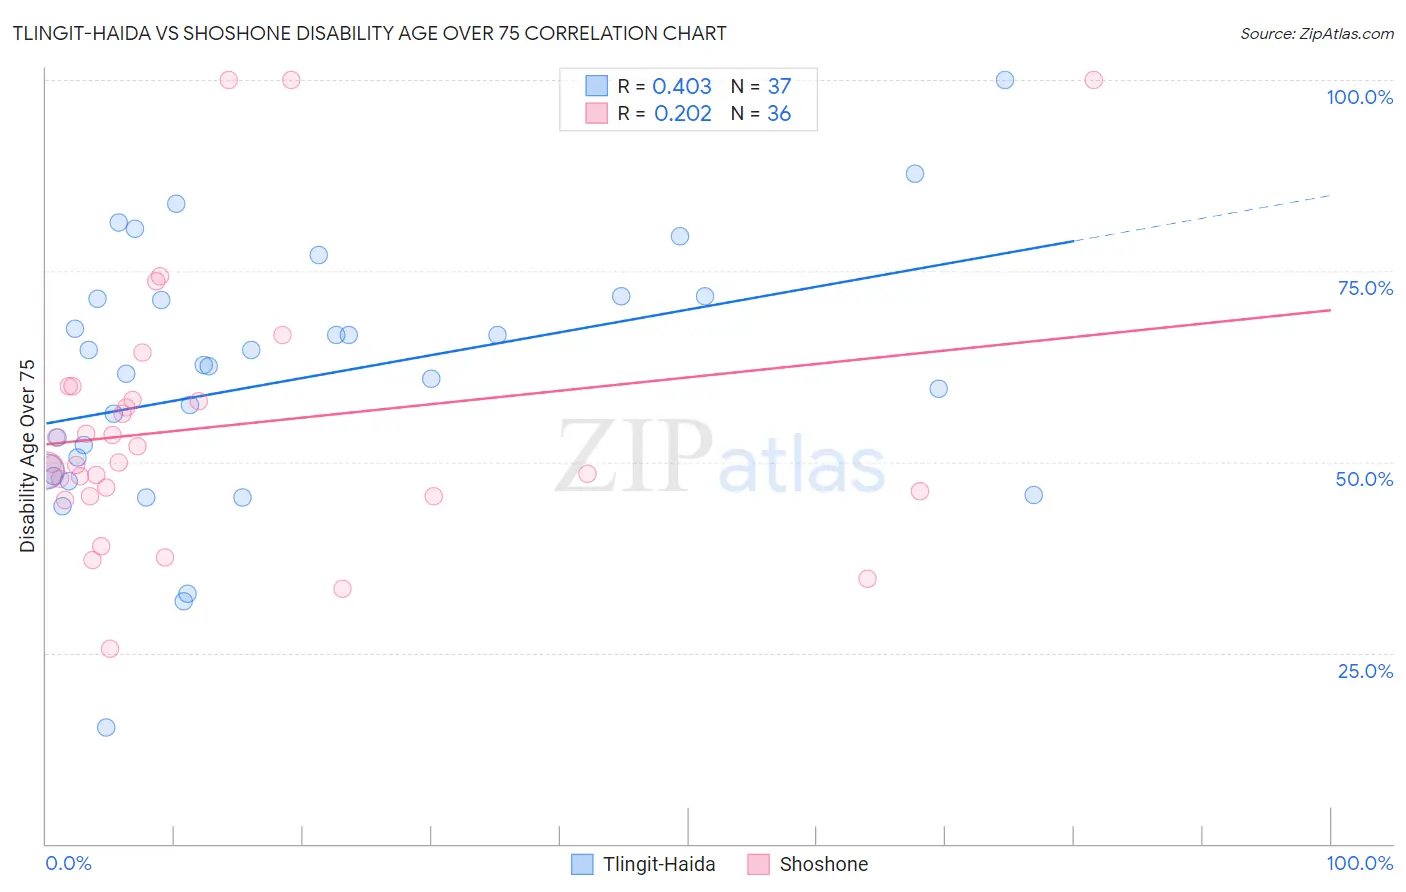
Tlingit-Haida vs Shoshone Disability Age Over 75 Correlation Chart
The statistical analysis conducted on geographies consisting of 60,768,842 people shows a moderate positive correlation between the proportion of Tlingit-Haida and percentage of population with a disability over the age of 75 in the United States with a correlation coefficient (R) of 0.403 and weighted average of 50.6%. Similarly, the statistical analysis conducted on geographies consisting of 66,589,461 people shows a weak positive correlation between the proportion of Shoshone and percentage of population with a disability over the age of 75 in the United States with a correlation coefficient (R) of 0.202 and weighted average of 49.9%, a difference of 1.5%.
Disability Age Over 75 Correlation Summary
| Measurement | Tlingit-Haida | Shoshone |
| Minimum | 15.2% | 25.5% |
| Maximum | 100.0% | 100.0% |
| Range | 84.8% | 74.5% |
| Mean | 60.9% | 54.7% |
| Median | 62.5% | 49.8% |
| Interquartile 25% (IQ1) | 48.4% | 45.8% |
| Interquartile 75% (IQ3) | 71.5% | 59.0% |
| Interquartile Range (IQR) | 23.0% | 13.2% |
| Standard Deviation (Sample) | 16.9% | 17.3% |
| Standard Deviation (Population) | 16.7% | 17.1% |
Demographics Similar to Tlingit-Haida and Shoshone by Disability Age Over 75
In terms of disability age over 75, the demographic groups most similar to Tlingit-Haida are Hispanic or Latino (50.6%, a difference of 0.040%), Aleut (50.6%, a difference of 0.040%), Immigrants from Fiji (50.6%, a difference of 0.070%), Cajun (50.7%, a difference of 0.10%), and Immigrants from Central America (50.5%, a difference of 0.12%). Similarly, the demographic groups most similar to Shoshone are Arapaho (49.8%, a difference of 0.070%), Spanish American Indian (49.9%, a difference of 0.15%), Immigrants from Cambodia (50.0%, a difference of 0.27%), Spanish American (50.0%, a difference of 0.31%), and Mexican American Indian (50.0%, a difference of 0.35%).
| Demographics | Rating | Rank | Disability Age Over 75 |
| Arapaho | 0.0 /100 | #291 | Tragic 49.8% |
| Shoshone | 0.0 /100 | #292 | Tragic 49.9% |
| Spanish American Indians | 0.0 /100 | #293 | Tragic 49.9% |
| Immigrants | Cambodia | 0.0 /100 | #294 | Tragic 50.0% |
| Spanish Americans | 0.0 /100 | #295 | Tragic 50.0% |
| Mexican American Indians | 0.0 /100 | #296 | Tragic 50.0% |
| Armenians | 0.0 /100 | #297 | Tragic 50.0% |
| Marshallese | 0.0 /100 | #298 | Tragic 50.1% |
| Immigrants | Micronesia | 0.0 /100 | #299 | Tragic 50.1% |
| Cape Verdeans | 0.0 /100 | #300 | Tragic 50.1% |
| Dominicans | 0.0 /100 | #301 | Tragic 50.2% |
| Cherokee | 0.0 /100 | #302 | Tragic 50.2% |
| Japanese | 0.0 /100 | #303 | Tragic 50.2% |
| Immigrants | Dominican Republic | 0.0 /100 | #304 | Tragic 50.3% |
| Central American Indians | 0.0 /100 | #305 | Tragic 50.5% |
| Immigrants | Central America | 0.0 /100 | #306 | Tragic 50.5% |
| Immigrants | Fiji | 0.0 /100 | #307 | Tragic 50.6% |
| Hispanics or Latinos | 0.0 /100 | #308 | Tragic 50.6% |
| Aleuts | 0.0 /100 | #309 | Tragic 50.6% |
| Tlingit-Haida | 0.0 /100 | #310 | Tragic 50.6% |
| Cajuns | 0.0 /100 | #311 | Tragic 50.7% |