Tlingit-Haida vs Honduran Disability Age Over 75
COMPARE
Tlingit-Haida
Honduran
Disability Age Over 75
Disability Age Over 75 Comparison
Tlingit-Haida
Hondurans
50.6%
DISABILITY AGE OVER 75
0.0/ 100
METRIC RATING
310th/ 347
METRIC RANK
48.9%
DISABILITY AGE OVER 75
0.3/ 100
METRIC RATING
265th/ 347
METRIC RANK
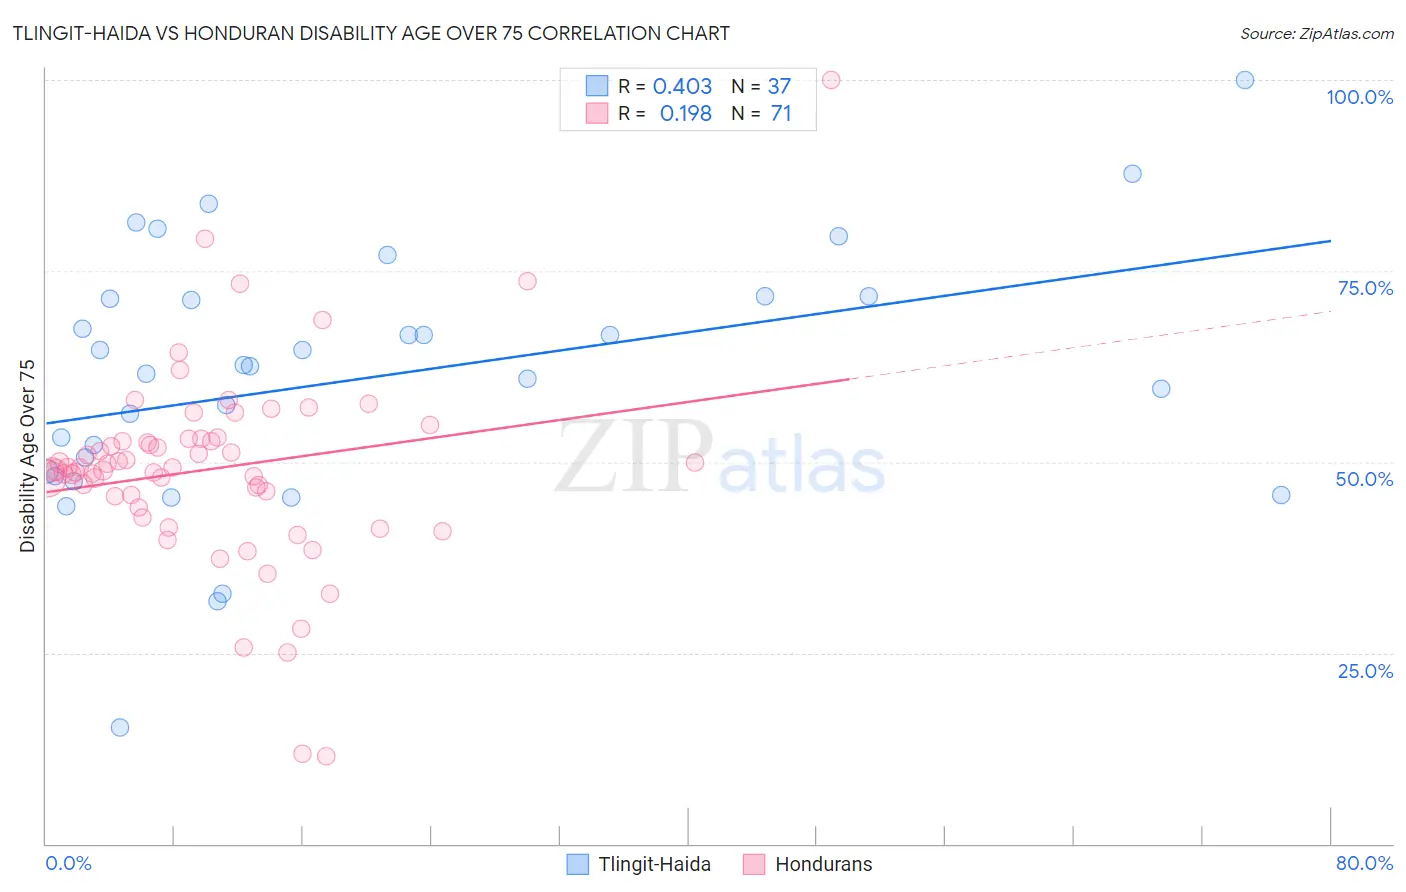
Tlingit-Haida vs Honduran Disability Age Over 75 Correlation Chart
The statistical analysis conducted on geographies consisting of 60,768,842 people shows a moderate positive correlation between the proportion of Tlingit-Haida and percentage of population with a disability over the age of 75 in the United States with a correlation coefficient (R) of 0.403 and weighted average of 50.6%. Similarly, the statistical analysis conducted on geographies consisting of 357,151,791 people shows a poor positive correlation between the proportion of Hondurans and percentage of population with a disability over the age of 75 in the United States with a correlation coefficient (R) of 0.198 and weighted average of 48.9%, a difference of 3.4%.
Disability Age Over 75 Correlation Summary
| Measurement | Tlingit-Haida | Honduran |
| Minimum | 15.2% | 11.4% |
| Maximum | 100.0% | 100.0% |
| Range | 84.8% | 88.6% |
| Mean | 60.9% | 49.1% |
| Median | 62.5% | 49.2% |
| Interquartile 25% (IQ1) | 48.4% | 45.5% |
| Interquartile 75% (IQ3) | 71.5% | 53.0% |
| Interquartile Range (IQR) | 23.0% | 7.6% |
| Standard Deviation (Sample) | 16.9% | 13.0% |
| Standard Deviation (Population) | 16.7% | 12.9% |
Similar Demographics by Disability Age Over 75
Demographics Similar to Tlingit-Haida by Disability Age Over 75
In terms of disability age over 75, the demographic groups most similar to Tlingit-Haida are Hispanic or Latino (50.6%, a difference of 0.040%), Aleut (50.6%, a difference of 0.040%), Immigrants from Fiji (50.6%, a difference of 0.070%), Cajun (50.7%, a difference of 0.10%), and Immigrants from Central America (50.5%, a difference of 0.12%).
| Demographics | Rating | Rank | Disability Age Over 75 |
| Japanese | 0.0 /100 | #303 | Tragic 50.2% |
| Immigrants | Dominican Republic | 0.0 /100 | #304 | Tragic 50.3% |
| Central American Indians | 0.0 /100 | #305 | Tragic 50.5% |
| Immigrants | Central America | 0.0 /100 | #306 | Tragic 50.5% |
| Immigrants | Fiji | 0.0 /100 | #307 | Tragic 50.6% |
| Hispanics or Latinos | 0.0 /100 | #308 | Tragic 50.6% |
| Aleuts | 0.0 /100 | #309 | Tragic 50.6% |
| Tlingit-Haida | 0.0 /100 | #310 | Tragic 50.6% |
| Cajuns | 0.0 /100 | #311 | Tragic 50.7% |
| Cheyenne | 0.0 /100 | #312 | Tragic 50.9% |
| Immigrants | Azores | 0.0 /100 | #313 | Tragic 50.9% |
| Immigrants | Mexico | 0.0 /100 | #314 | Tragic 51.1% |
| Mexicans | 0.0 /100 | #315 | Tragic 51.1% |
| Chickasaw | 0.0 /100 | #316 | Tragic 51.2% |
| Yakama | 0.0 /100 | #317 | Tragic 51.3% |
Demographics Similar to Hondurans by Disability Age Over 75
In terms of disability age over 75, the demographic groups most similar to Hondurans are Immigrants from Honduras (48.9%, a difference of 0.010%), U.S. Virgin Islander (48.9%, a difference of 0.030%), Salvadoran (48.9%, a difference of 0.060%), Immigrants from West Indies (48.9%, a difference of 0.080%), and African (48.9%, a difference of 0.14%).
| Demographics | Rating | Rank | Disability Age Over 75 |
| Immigrants | Philippines | 0.4 /100 | #258 | Tragic 48.8% |
| Central Americans | 0.4 /100 | #259 | Tragic 48.8% |
| Immigrants | Afghanistan | 0.4 /100 | #260 | Tragic 48.8% |
| Africans | 0.3 /100 | #261 | Tragic 48.9% |
| Immigrants | West Indies | 0.3 /100 | #262 | Tragic 48.9% |
| Salvadorans | 0.3 /100 | #263 | Tragic 48.9% |
| Immigrants | Honduras | 0.3 /100 | #264 | Tragic 48.9% |
| Hondurans | 0.3 /100 | #265 | Tragic 48.9% |
| U.S. Virgin Islanders | 0.2 /100 | #266 | Tragic 48.9% |
| Malaysians | 0.2 /100 | #267 | Tragic 49.0% |
| Guatemalans | 0.2 /100 | #268 | Tragic 49.0% |
| Immigrants | El Salvador | 0.2 /100 | #269 | Tragic 49.0% |
| Potawatomi | 0.2 /100 | #270 | Tragic 49.0% |
| Fijians | 0.2 /100 | #271 | Tragic 49.0% |
| Assyrians/Chaldeans/Syriacs | 0.2 /100 | #272 | Tragic 49.1% |