Tlingit-Haida vs Central American Disability Age Over 75
COMPARE
Tlingit-Haida
Central American
Disability Age Over 75
Disability Age Over 75 Comparison
Tlingit-Haida
Central Americans
50.6%
DISABILITY AGE OVER 75
0.0/ 100
METRIC RATING
310th/ 347
METRIC RANK
48.8%
DISABILITY AGE OVER 75
0.4/ 100
METRIC RATING
259th/ 347
METRIC RANK
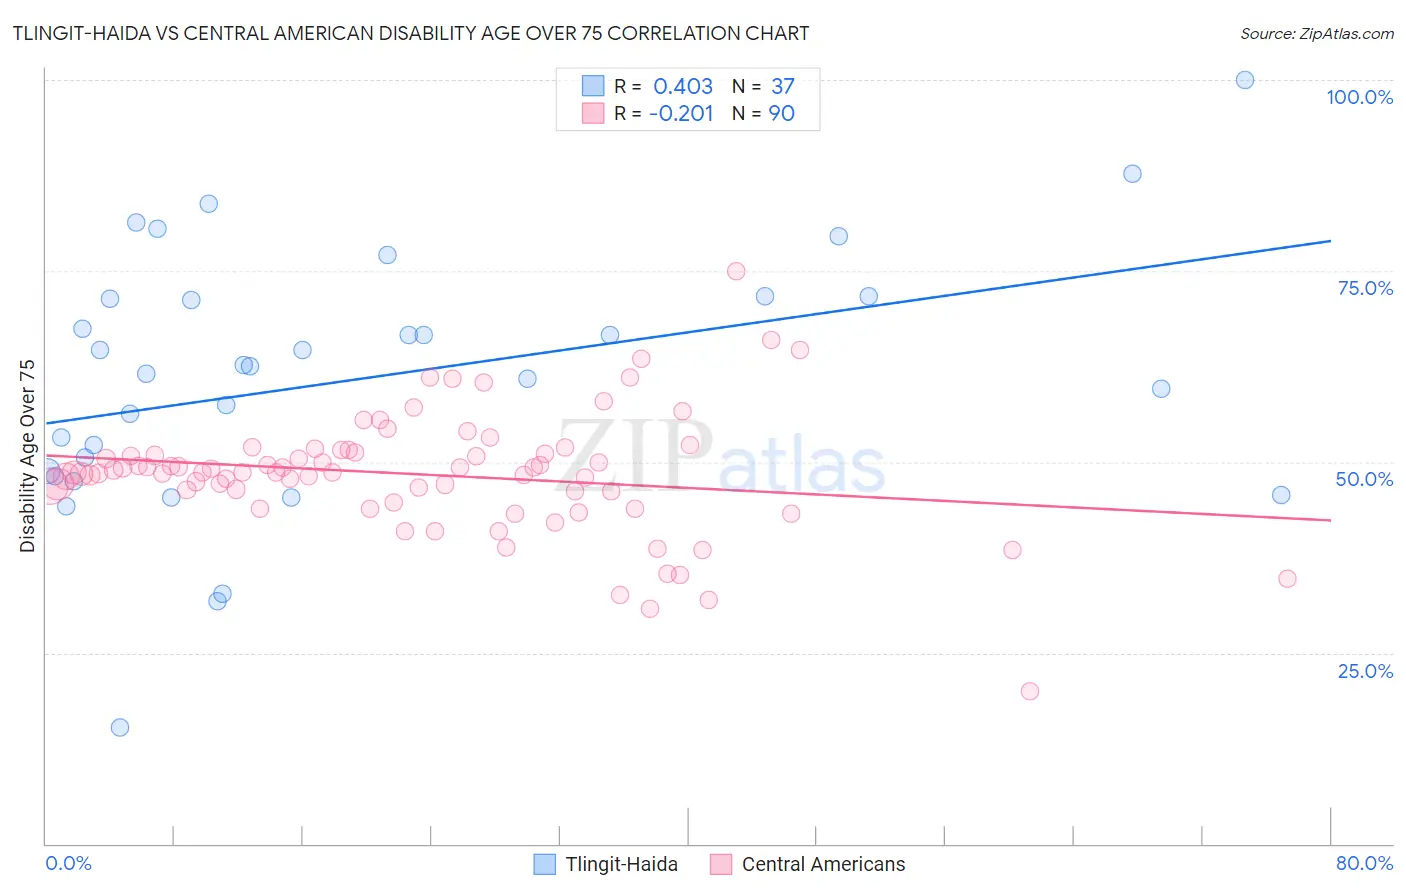
Tlingit-Haida vs Central American Disability Age Over 75 Correlation Chart
The statistical analysis conducted on geographies consisting of 60,768,842 people shows a moderate positive correlation between the proportion of Tlingit-Haida and percentage of population with a disability over the age of 75 in the United States with a correlation coefficient (R) of 0.403 and weighted average of 50.6%. Similarly, the statistical analysis conducted on geographies consisting of 503,152,130 people shows a weak negative correlation between the proportion of Central Americans and percentage of population with a disability over the age of 75 in the United States with a correlation coefficient (R) of -0.201 and weighted average of 48.8%, a difference of 3.7%.
Disability Age Over 75 Correlation Summary
| Measurement | Tlingit-Haida | Central American |
| Minimum | 15.2% | 20.0% |
| Maximum | 100.0% | 75.0% |
| Range | 84.8% | 55.0% |
| Mean | 60.9% | 48.4% |
| Median | 62.5% | 48.6% |
| Interquartile 25% (IQ1) | 48.4% | 46.1% |
| Interquartile 75% (IQ3) | 71.5% | 51.3% |
| Interquartile Range (IQR) | 23.0% | 5.1% |
| Standard Deviation (Sample) | 16.9% | 8.0% |
| Standard Deviation (Population) | 16.7% | 7.9% |
Similar Demographics by Disability Age Over 75
Demographics Similar to Tlingit-Haida by Disability Age Over 75
In terms of disability age over 75, the demographic groups most similar to Tlingit-Haida are Hispanic or Latino (50.6%, a difference of 0.040%), Aleut (50.6%, a difference of 0.040%), Immigrants from Fiji (50.6%, a difference of 0.070%), Cajun (50.7%, a difference of 0.10%), and Immigrants from Central America (50.5%, a difference of 0.12%).
| Demographics | Rating | Rank | Disability Age Over 75 |
| Japanese | 0.0 /100 | #303 | Tragic 50.2% |
| Immigrants | Dominican Republic | 0.0 /100 | #304 | Tragic 50.3% |
| Central American Indians | 0.0 /100 | #305 | Tragic 50.5% |
| Immigrants | Central America | 0.0 /100 | #306 | Tragic 50.5% |
| Immigrants | Fiji | 0.0 /100 | #307 | Tragic 50.6% |
| Hispanics or Latinos | 0.0 /100 | #308 | Tragic 50.6% |
| Aleuts | 0.0 /100 | #309 | Tragic 50.6% |
| Tlingit-Haida | 0.0 /100 | #310 | Tragic 50.6% |
| Cajuns | 0.0 /100 | #311 | Tragic 50.7% |
| Cheyenne | 0.0 /100 | #312 | Tragic 50.9% |
| Immigrants | Azores | 0.0 /100 | #313 | Tragic 50.9% |
| Immigrants | Mexico | 0.0 /100 | #314 | Tragic 51.1% |
| Mexicans | 0.0 /100 | #315 | Tragic 51.1% |
| Chickasaw | 0.0 /100 | #316 | Tragic 51.2% |
| Yakama | 0.0 /100 | #317 | Tragic 51.3% |
Demographics Similar to Central Americans by Disability Age Over 75
In terms of disability age over 75, the demographic groups most similar to Central Americans are Immigrants from Afghanistan (48.8%, a difference of 0.040%), Immigrants from Philippines (48.8%, a difference of 0.070%), African (48.9%, a difference of 0.10%), Blackfeet (48.8%, a difference of 0.11%), and Immigrants from West Indies (48.9%, a difference of 0.16%).
| Demographics | Rating | Rank | Disability Age Over 75 |
| Immigrants | South Eastern Asia | 0.7 /100 | #252 | Tragic 48.7% |
| British West Indians | 0.6 /100 | #253 | Tragic 48.7% |
| Immigrants | Vietnam | 0.6 /100 | #254 | Tragic 48.7% |
| Chinese | 0.5 /100 | #255 | Tragic 48.7% |
| Immigrants | Congo | 0.5 /100 | #256 | Tragic 48.7% |
| Blackfeet | 0.5 /100 | #257 | Tragic 48.8% |
| Immigrants | Philippines | 0.4 /100 | #258 | Tragic 48.8% |
| Central Americans | 0.4 /100 | #259 | Tragic 48.8% |
| Immigrants | Afghanistan | 0.4 /100 | #260 | Tragic 48.8% |
| Africans | 0.3 /100 | #261 | Tragic 48.9% |
| Immigrants | West Indies | 0.3 /100 | #262 | Tragic 48.9% |
| Salvadorans | 0.3 /100 | #263 | Tragic 48.9% |
| Immigrants | Honduras | 0.3 /100 | #264 | Tragic 48.9% |
| Hondurans | 0.3 /100 | #265 | Tragic 48.9% |
| U.S. Virgin Islanders | 0.2 /100 | #266 | Tragic 48.9% |