Tlingit-Haida vs Immigrants from Laos Disability Age Over 75
COMPARE
Tlingit-Haida
Immigrants from Laos
Disability Age Over 75
Disability Age Over 75 Comparison
Tlingit-Haida
Immigrants from Laos
50.6%
DISABILITY AGE OVER 75
0.0/ 100
METRIC RATING
310th/ 347
METRIC RANK
49.2%
DISABILITY AGE OVER 75
0.1/ 100
METRIC RATING
278th/ 347
METRIC RANK
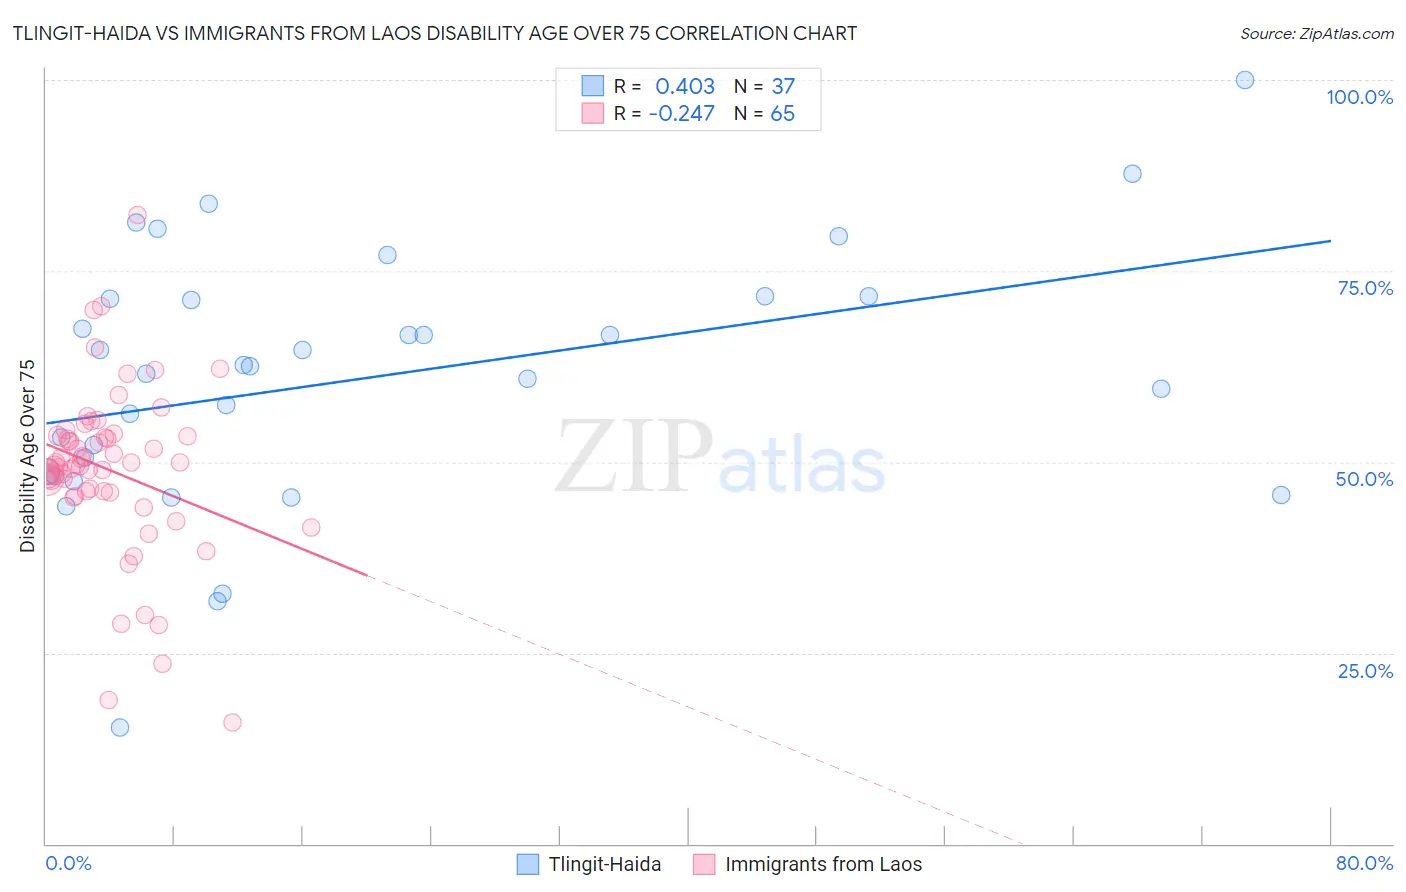
Tlingit-Haida vs Immigrants from Laos Disability Age Over 75 Correlation Chart
The statistical analysis conducted on geographies consisting of 60,768,842 people shows a moderate positive correlation between the proportion of Tlingit-Haida and percentage of population with a disability over the age of 75 in the United States with a correlation coefficient (R) of 0.403 and weighted average of 50.6%. Similarly, the statistical analysis conducted on geographies consisting of 201,421,107 people shows a weak negative correlation between the proportion of Immigrants from Laos and percentage of population with a disability over the age of 75 in the United States with a correlation coefficient (R) of -0.247 and weighted average of 49.2%, a difference of 2.8%.
Disability Age Over 75 Correlation Summary
| Measurement | Tlingit-Haida | Immigrants from Laos |
| Minimum | 15.2% | 15.9% |
| Maximum | 100.0% | 82.4% |
| Range | 84.8% | 66.5% |
| Mean | 60.9% | 49.0% |
| Median | 62.5% | 49.7% |
| Interquartile 25% (IQ1) | 48.4% | 46.1% |
| Interquartile 75% (IQ3) | 71.5% | 53.4% |
| Interquartile Range (IQR) | 23.0% | 7.3% |
| Standard Deviation (Sample) | 16.9% | 11.0% |
| Standard Deviation (Population) | 16.7% | 10.9% |
Similar Demographics by Disability Age Over 75
Demographics Similar to Tlingit-Haida by Disability Age Over 75
In terms of disability age over 75, the demographic groups most similar to Tlingit-Haida are Hispanic or Latino (50.6%, a difference of 0.040%), Aleut (50.6%, a difference of 0.040%), Immigrants from Fiji (50.6%, a difference of 0.070%), Cajun (50.7%, a difference of 0.10%), and Immigrants from Central America (50.5%, a difference of 0.12%).
| Demographics | Rating | Rank | Disability Age Over 75 |
| Japanese | 0.0 /100 | #303 | Tragic 50.2% |
| Immigrants | Dominican Republic | 0.0 /100 | #304 | Tragic 50.3% |
| Central American Indians | 0.0 /100 | #305 | Tragic 50.5% |
| Immigrants | Central America | 0.0 /100 | #306 | Tragic 50.5% |
| Immigrants | Fiji | 0.0 /100 | #307 | Tragic 50.6% |
| Hispanics or Latinos | 0.0 /100 | #308 | Tragic 50.6% |
| Aleuts | 0.0 /100 | #309 | Tragic 50.6% |
| Tlingit-Haida | 0.0 /100 | #310 | Tragic 50.6% |
| Cajuns | 0.0 /100 | #311 | Tragic 50.7% |
| Cheyenne | 0.0 /100 | #312 | Tragic 50.9% |
| Immigrants | Azores | 0.0 /100 | #313 | Tragic 50.9% |
| Immigrants | Mexico | 0.0 /100 | #314 | Tragic 51.1% |
| Mexicans | 0.0 /100 | #315 | Tragic 51.1% |
| Chickasaw | 0.0 /100 | #316 | Tragic 51.2% |
| Yakama | 0.0 /100 | #317 | Tragic 51.3% |
Demographics Similar to Immigrants from Laos by Disability Age Over 75
In terms of disability age over 75, the demographic groups most similar to Immigrants from Laos are Hawaiian (49.2%, a difference of 0.030%), Immigrants from Uzbekistan (49.2%, a difference of 0.060%), Immigrants from Dominica (49.1%, a difference of 0.17%), Immigrants from Guatemala (49.1%, a difference of 0.18%), and Immigrants from Iraq (49.1%, a difference of 0.26%).
| Demographics | Rating | Rank | Disability Age Over 75 |
| Fijians | 0.2 /100 | #271 | Tragic 49.0% |
| Assyrians/Chaldeans/Syriacs | 0.2 /100 | #272 | Tragic 49.1% |
| Immigrants | Iraq | 0.1 /100 | #273 | Tragic 49.1% |
| Immigrants | Guatemala | 0.1 /100 | #274 | Tragic 49.1% |
| Immigrants | Dominica | 0.1 /100 | #275 | Tragic 49.1% |
| Immigrants | Uzbekistan | 0.1 /100 | #276 | Tragic 49.2% |
| Hawaiians | 0.1 /100 | #277 | Tragic 49.2% |
| Immigrants | Laos | 0.1 /100 | #278 | Tragic 49.2% |
| Guamanians/Chamorros | 0.0 /100 | #279 | Tragic 49.4% |
| Bangladeshis | 0.0 /100 | #280 | Tragic 49.4% |
| Belizeans | 0.0 /100 | #281 | Tragic 49.4% |
| Blacks/African Americans | 0.0 /100 | #282 | Tragic 49.5% |
| Samoans | 0.0 /100 | #283 | Tragic 49.5% |
| Immigrants | Latin America | 0.0 /100 | #284 | Tragic 49.5% |
| Crow | 0.0 /100 | #285 | Tragic 49.6% |