Tlingit-Haida vs Immigrants from Croatia Disability Age Over 75
COMPARE
Tlingit-Haida
Immigrants from Croatia
Disability Age Over 75
Disability Age Over 75 Comparison
Tlingit-Haida
Immigrants from Croatia
50.6%
DISABILITY AGE OVER 75
0.0/ 100
METRIC RATING
310th/ 347
METRIC RANK
45.5%
DISABILITY AGE OVER 75
99.9/ 100
METRIC RATING
33rd/ 347
METRIC RANK
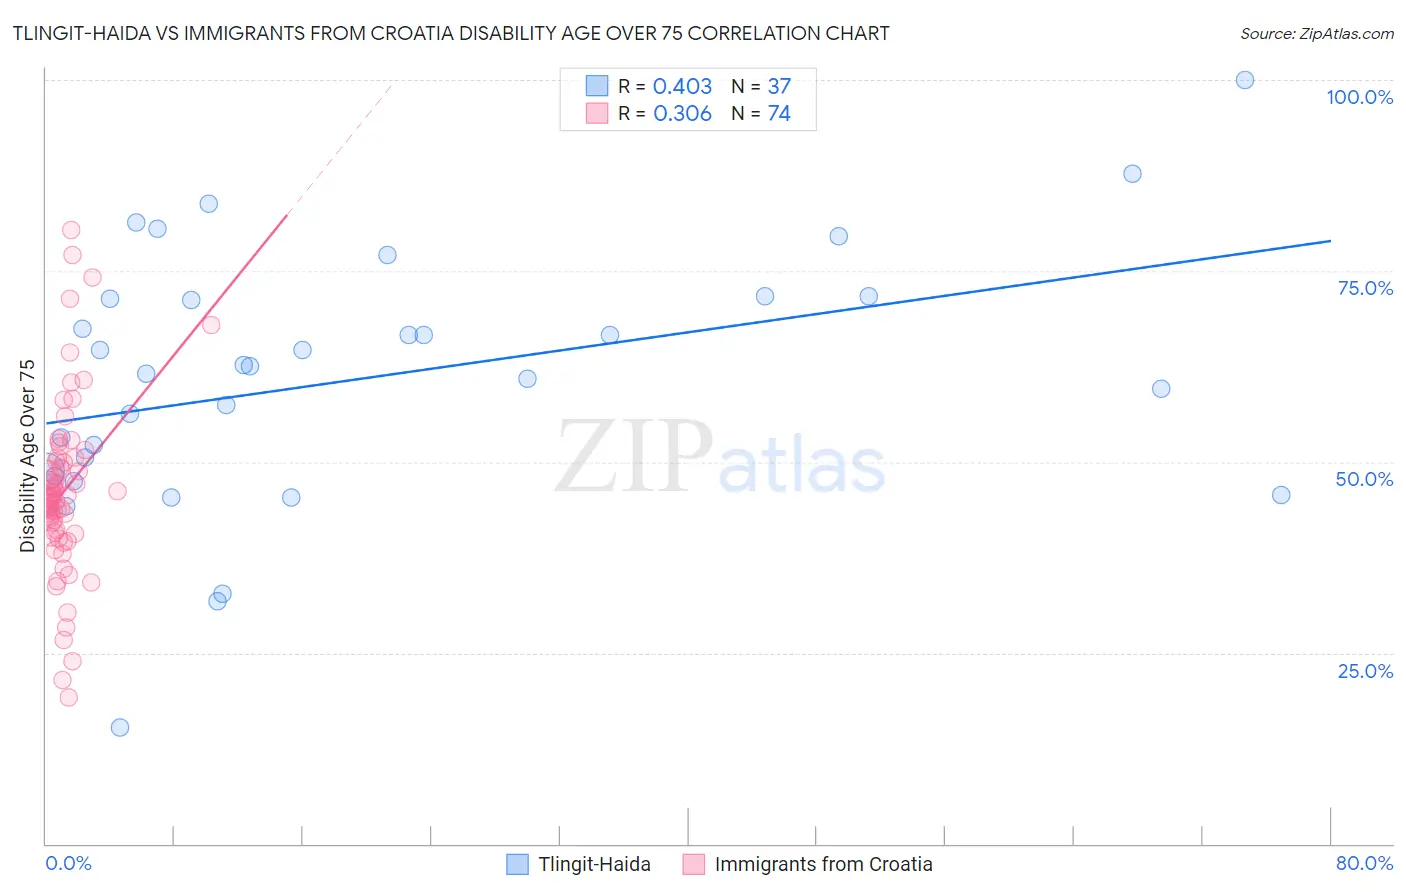
Tlingit-Haida vs Immigrants from Croatia Disability Age Over 75 Correlation Chart
The statistical analysis conducted on geographies consisting of 60,768,842 people shows a moderate positive correlation between the proportion of Tlingit-Haida and percentage of population with a disability over the age of 75 in the United States with a correlation coefficient (R) of 0.403 and weighted average of 50.6%. Similarly, the statistical analysis conducted on geographies consisting of 132,556,721 people shows a mild positive correlation between the proportion of Immigrants from Croatia and percentage of population with a disability over the age of 75 in the United States with a correlation coefficient (R) of 0.306 and weighted average of 45.5%, a difference of 11.2%.
Disability Age Over 75 Correlation Summary
| Measurement | Tlingit-Haida | Immigrants from Croatia |
| Minimum | 15.2% | 19.1% |
| Maximum | 100.0% | 80.4% |
| Range | 84.8% | 61.3% |
| Mean | 60.9% | 46.2% |
| Median | 62.5% | 45.3% |
| Interquartile 25% (IQ1) | 48.4% | 40.8% |
| Interquartile 75% (IQ3) | 71.5% | 50.0% |
| Interquartile Range (IQR) | 23.0% | 9.3% |
| Standard Deviation (Sample) | 16.9% | 11.4% |
| Standard Deviation (Population) | 16.7% | 11.3% |
Similar Demographics by Disability Age Over 75
Demographics Similar to Tlingit-Haida by Disability Age Over 75
In terms of disability age over 75, the demographic groups most similar to Tlingit-Haida are Hispanic or Latino (50.6%, a difference of 0.040%), Aleut (50.6%, a difference of 0.040%), Immigrants from Fiji (50.6%, a difference of 0.070%), Cajun (50.7%, a difference of 0.10%), and Immigrants from Central America (50.5%, a difference of 0.12%).
| Demographics | Rating | Rank | Disability Age Over 75 |
| Japanese | 0.0 /100 | #303 | Tragic 50.2% |
| Immigrants | Dominican Republic | 0.0 /100 | #304 | Tragic 50.3% |
| Central American Indians | 0.0 /100 | #305 | Tragic 50.5% |
| Immigrants | Central America | 0.0 /100 | #306 | Tragic 50.5% |
| Immigrants | Fiji | 0.0 /100 | #307 | Tragic 50.6% |
| Hispanics or Latinos | 0.0 /100 | #308 | Tragic 50.6% |
| Aleuts | 0.0 /100 | #309 | Tragic 50.6% |
| Tlingit-Haida | 0.0 /100 | #310 | Tragic 50.6% |
| Cajuns | 0.0 /100 | #311 | Tragic 50.7% |
| Cheyenne | 0.0 /100 | #312 | Tragic 50.9% |
| Immigrants | Azores | 0.0 /100 | #313 | Tragic 50.9% |
| Immigrants | Mexico | 0.0 /100 | #314 | Tragic 51.1% |
| Mexicans | 0.0 /100 | #315 | Tragic 51.1% |
| Chickasaw | 0.0 /100 | #316 | Tragic 51.2% |
| Yakama | 0.0 /100 | #317 | Tragic 51.3% |
Demographics Similar to Immigrants from Croatia by Disability Age Over 75
In terms of disability age over 75, the demographic groups most similar to Immigrants from Croatia are Russian (45.5%, a difference of 0.030%), Norwegian (45.5%, a difference of 0.040%), Immigrants from Australia (45.5%, a difference of 0.060%), Immigrants from Taiwan (45.5%, a difference of 0.070%), and South African (45.5%, a difference of 0.070%).
| Demographics | Rating | Rank | Disability Age Over 75 |
| Macedonians | 99.9 /100 | #26 | Exceptional 45.4% |
| Immigrants | Poland | 99.9 /100 | #27 | Exceptional 45.4% |
| Thais | 99.9 /100 | #28 | Exceptional 45.4% |
| Filipinos | 99.9 /100 | #29 | Exceptional 45.4% |
| Immigrants | Denmark | 99.9 /100 | #30 | Exceptional 45.4% |
| Immigrants | Bulgaria | 99.9 /100 | #31 | Exceptional 45.5% |
| Immigrants | Australia | 99.9 /100 | #32 | Exceptional 45.5% |
| Immigrants | Croatia | 99.9 /100 | #33 | Exceptional 45.5% |
| Russians | 99.9 /100 | #34 | Exceptional 45.5% |
| Norwegians | 99.9 /100 | #35 | Exceptional 45.5% |
| Immigrants | Taiwan | 99.9 /100 | #36 | Exceptional 45.5% |
| South Africans | 99.9 /100 | #37 | Exceptional 45.5% |
| Italians | 99.9 /100 | #38 | Exceptional 45.6% |
| Estonians | 99.9 /100 | #39 | Exceptional 45.6% |
| Slovenes | 99.9 /100 | #40 | Exceptional 45.6% |