Tlingit-Haida vs Scandinavian Disability Age Over 75
COMPARE
Tlingit-Haida
Scandinavian
Disability Age Over 75
Disability Age Over 75 Comparison
Tlingit-Haida
Scandinavians
50.6%
DISABILITY AGE OVER 75
0.0/ 100
METRIC RATING
310th/ 347
METRIC RANK
46.6%
DISABILITY AGE OVER 75
93.6/ 100
METRIC RATING
121st/ 347
METRIC RANK
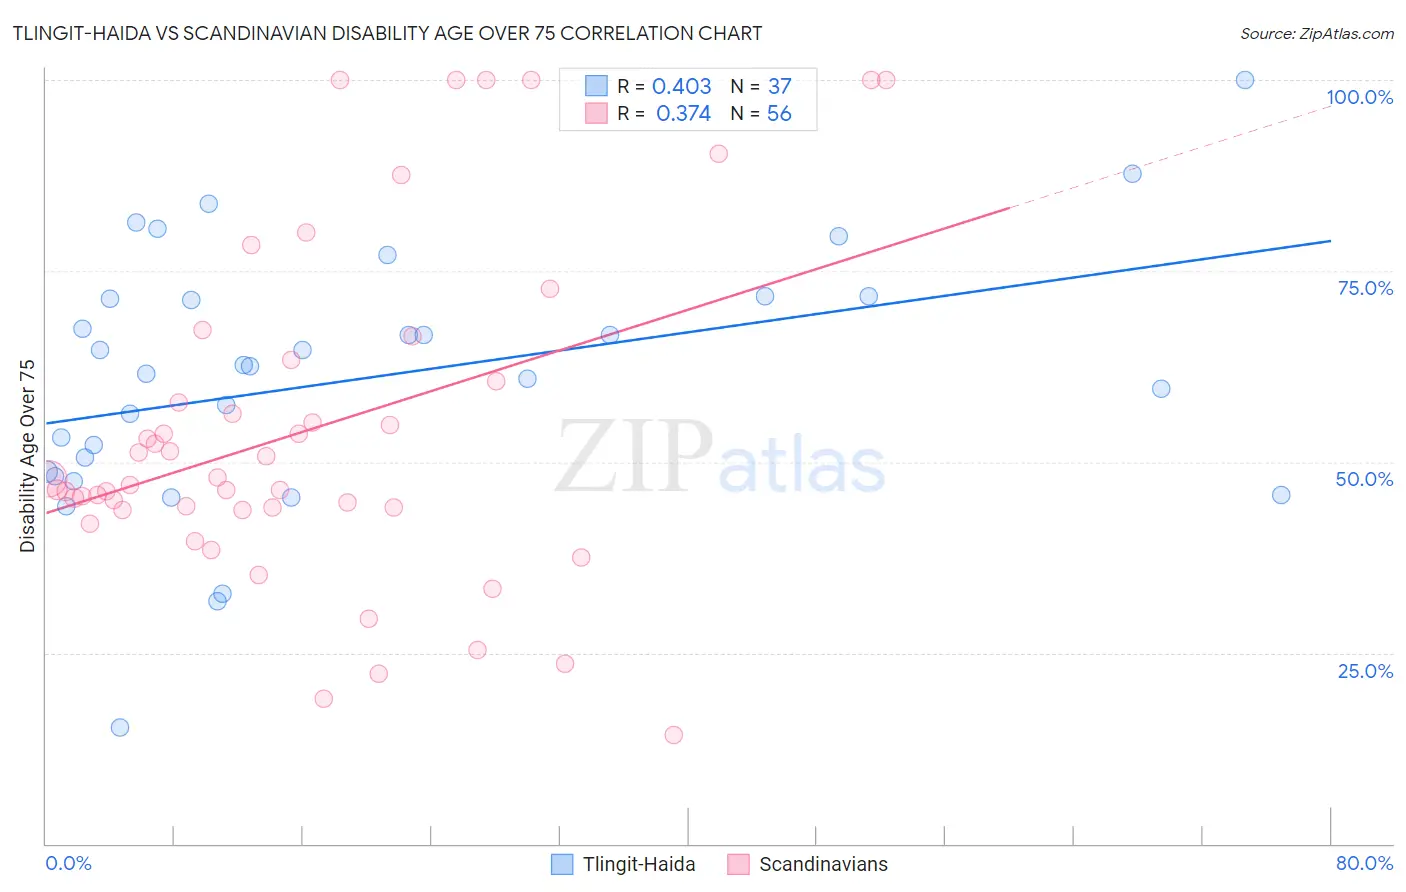
Tlingit-Haida vs Scandinavian Disability Age Over 75 Correlation Chart
The statistical analysis conducted on geographies consisting of 60,768,842 people shows a moderate positive correlation between the proportion of Tlingit-Haida and percentage of population with a disability over the age of 75 in the United States with a correlation coefficient (R) of 0.403 and weighted average of 50.6%. Similarly, the statistical analysis conducted on geographies consisting of 471,447,012 people shows a mild positive correlation between the proportion of Scandinavians and percentage of population with a disability over the age of 75 in the United States with a correlation coefficient (R) of 0.374 and weighted average of 46.6%, a difference of 8.5%.
Disability Age Over 75 Correlation Summary
| Measurement | Tlingit-Haida | Scandinavian |
| Minimum | 15.2% | 14.3% |
| Maximum | 100.0% | 100.0% |
| Range | 84.8% | 85.7% |
| Mean | 60.9% | 54.2% |
| Median | 62.5% | 47.4% |
| Interquartile 25% (IQ1) | 48.4% | 43.9% |
| Interquartile 75% (IQ3) | 71.5% | 62.0% |
| Interquartile Range (IQR) | 23.0% | 18.1% |
| Standard Deviation (Sample) | 16.9% | 21.9% |
| Standard Deviation (Population) | 16.7% | 21.7% |
Similar Demographics by Disability Age Over 75
Demographics Similar to Tlingit-Haida by Disability Age Over 75
In terms of disability age over 75, the demographic groups most similar to Tlingit-Haida are Hispanic or Latino (50.6%, a difference of 0.040%), Aleut (50.6%, a difference of 0.040%), Immigrants from Fiji (50.6%, a difference of 0.070%), Cajun (50.7%, a difference of 0.10%), and Immigrants from Central America (50.5%, a difference of 0.12%).
| Demographics | Rating | Rank | Disability Age Over 75 |
| Japanese | 0.0 /100 | #303 | Tragic 50.2% |
| Immigrants | Dominican Republic | 0.0 /100 | #304 | Tragic 50.3% |
| Central American Indians | 0.0 /100 | #305 | Tragic 50.5% |
| Immigrants | Central America | 0.0 /100 | #306 | Tragic 50.5% |
| Immigrants | Fiji | 0.0 /100 | #307 | Tragic 50.6% |
| Hispanics or Latinos | 0.0 /100 | #308 | Tragic 50.6% |
| Aleuts | 0.0 /100 | #309 | Tragic 50.6% |
| Tlingit-Haida | 0.0 /100 | #310 | Tragic 50.6% |
| Cajuns | 0.0 /100 | #311 | Tragic 50.7% |
| Cheyenne | 0.0 /100 | #312 | Tragic 50.9% |
| Immigrants | Azores | 0.0 /100 | #313 | Tragic 50.9% |
| Immigrants | Mexico | 0.0 /100 | #314 | Tragic 51.1% |
| Mexicans | 0.0 /100 | #315 | Tragic 51.1% |
| Chickasaw | 0.0 /100 | #316 | Tragic 51.2% |
| Yakama | 0.0 /100 | #317 | Tragic 51.3% |
Demographics Similar to Scandinavians by Disability Age Over 75
In terms of disability age over 75, the demographic groups most similar to Scandinavians are Immigrants from Nepal (46.6%, a difference of 0.050%), Immigrants from Albania (46.6%, a difference of 0.050%), Canadian (46.6%, a difference of 0.080%), Czechoslovakian (46.6%, a difference of 0.10%), and Immigrants from Colombia (46.7%, a difference of 0.10%).
| Demographics | Rating | Rank | Disability Age Over 75 |
| Dutch | 95.9 /100 | #114 | Exceptional 46.5% |
| British | 95.7 /100 | #115 | Exceptional 46.5% |
| Indians (Asian) | 95.7 /100 | #116 | Exceptional 46.5% |
| Hungarians | 95.3 /100 | #117 | Exceptional 46.5% |
| Czechoslovakians | 94.7 /100 | #118 | Exceptional 46.6% |
| Canadians | 94.4 /100 | #119 | Exceptional 46.6% |
| Immigrants | Nepal | 94.1 /100 | #120 | Exceptional 46.6% |
| Scandinavians | 93.6 /100 | #121 | Exceptional 46.6% |
| Immigrants | Albania | 93.2 /100 | #122 | Exceptional 46.6% |
| Immigrants | Colombia | 92.6 /100 | #123 | Exceptional 46.7% |
| Immigrants | South America | 91.8 /100 | #124 | Exceptional 46.7% |
| Colombians | 91.3 /100 | #125 | Exceptional 46.7% |
| Europeans | 91.2 /100 | #126 | Exceptional 46.7% |
| Syrians | 91.1 /100 | #127 | Exceptional 46.7% |
| Icelanders | 90.9 /100 | #128 | Exceptional 46.7% |