Tlingit-Haida vs French Canadian Disability Age Over 75
COMPARE
Tlingit-Haida
French Canadian
Disability Age Over 75
Disability Age Over 75 Comparison
Tlingit-Haida
French Canadians
50.6%
DISABILITY AGE OVER 75
0.0/ 100
METRIC RATING
310th/ 347
METRIC RANK
47.0%
DISABILITY AGE OVER 75
79.0/ 100
METRIC RATING
151st/ 347
METRIC RANK
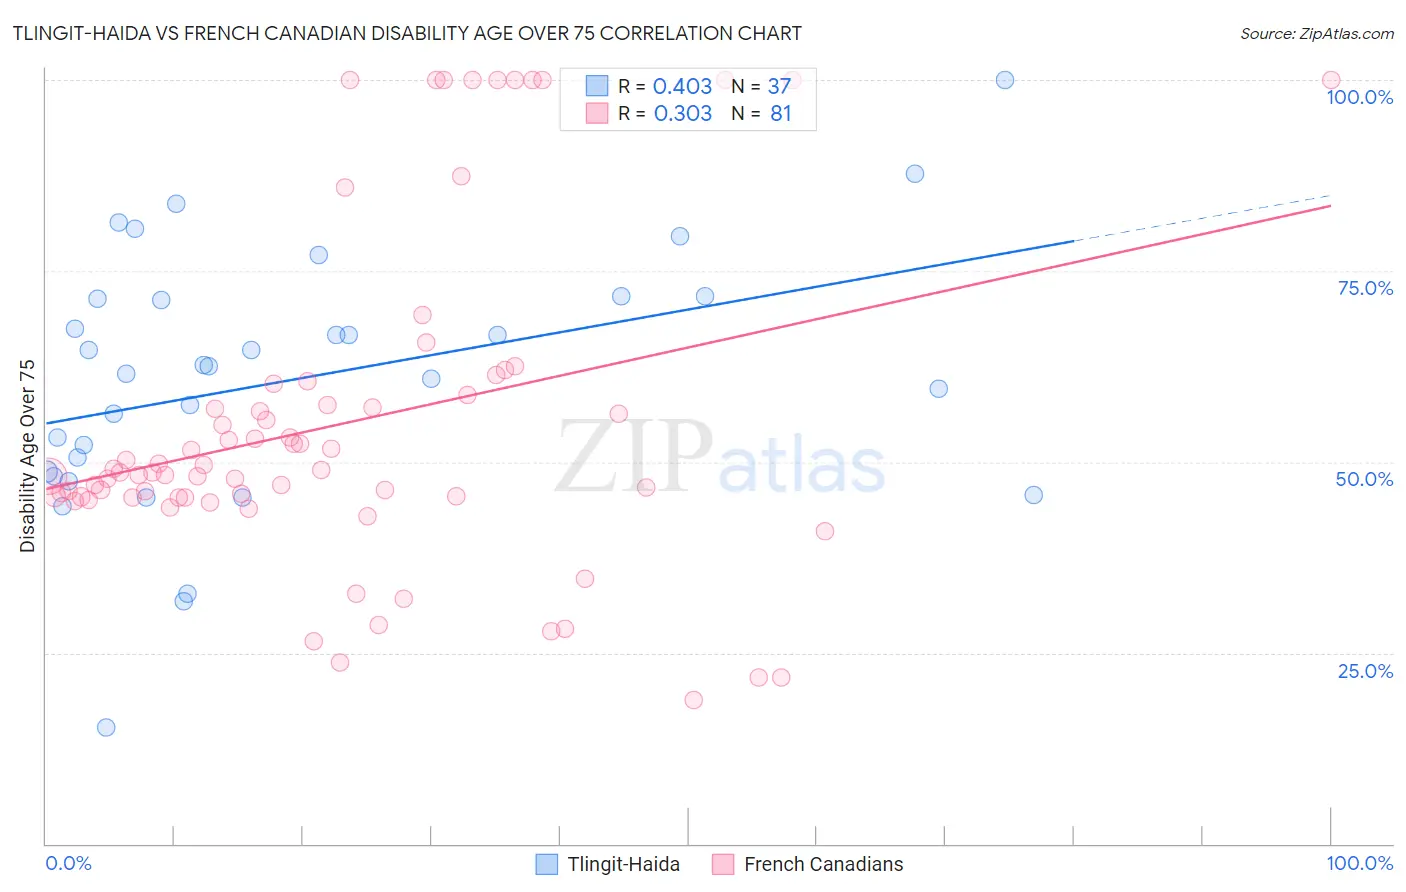
Tlingit-Haida vs French Canadian Disability Age Over 75 Correlation Chart
The statistical analysis conducted on geographies consisting of 60,768,842 people shows a moderate positive correlation between the proportion of Tlingit-Haida and percentage of population with a disability over the age of 75 in the United States with a correlation coefficient (R) of 0.403 and weighted average of 50.6%. Similarly, the statistical analysis conducted on geographies consisting of 501,362,781 people shows a mild positive correlation between the proportion of French Canadians and percentage of population with a disability over the age of 75 in the United States with a correlation coefficient (R) of 0.303 and weighted average of 47.0%, a difference of 7.7%.
Disability Age Over 75 Correlation Summary
| Measurement | Tlingit-Haida | French Canadian |
| Minimum | 15.2% | 18.8% |
| Maximum | 100.0% | 100.0% |
| Range | 84.8% | 81.2% |
| Mean | 60.9% | 55.1% |
| Median | 62.5% | 48.7% |
| Interquartile 25% (IQ1) | 48.4% | 45.4% |
| Interquartile 75% (IQ3) | 71.5% | 59.5% |
| Interquartile Range (IQR) | 23.0% | 14.1% |
| Standard Deviation (Sample) | 16.9% | 21.3% |
| Standard Deviation (Population) | 16.7% | 21.2% |
Similar Demographics by Disability Age Over 75
Demographics Similar to Tlingit-Haida by Disability Age Over 75
In terms of disability age over 75, the demographic groups most similar to Tlingit-Haida are Hispanic or Latino (50.6%, a difference of 0.040%), Aleut (50.6%, a difference of 0.040%), Immigrants from Fiji (50.6%, a difference of 0.070%), Cajun (50.7%, a difference of 0.10%), and Immigrants from Central America (50.5%, a difference of 0.12%).
| Demographics | Rating | Rank | Disability Age Over 75 |
| Japanese | 0.0 /100 | #303 | Tragic 50.2% |
| Immigrants | Dominican Republic | 0.0 /100 | #304 | Tragic 50.3% |
| Central American Indians | 0.0 /100 | #305 | Tragic 50.5% |
| Immigrants | Central America | 0.0 /100 | #306 | Tragic 50.5% |
| Immigrants | Fiji | 0.0 /100 | #307 | Tragic 50.6% |
| Hispanics or Latinos | 0.0 /100 | #308 | Tragic 50.6% |
| Aleuts | 0.0 /100 | #309 | Tragic 50.6% |
| Tlingit-Haida | 0.0 /100 | #310 | Tragic 50.6% |
| Cajuns | 0.0 /100 | #311 | Tragic 50.7% |
| Cheyenne | 0.0 /100 | #312 | Tragic 50.9% |
| Immigrants | Azores | 0.0 /100 | #313 | Tragic 50.9% |
| Immigrants | Mexico | 0.0 /100 | #314 | Tragic 51.1% |
| Mexicans | 0.0 /100 | #315 | Tragic 51.1% |
| Chickasaw | 0.0 /100 | #316 | Tragic 51.2% |
| Yakama | 0.0 /100 | #317 | Tragic 51.3% |
Demographics Similar to French Canadians by Disability Age Over 75
In terms of disability age over 75, the demographic groups most similar to French Canadians are Immigrants from Russia (47.0%, a difference of 0.010%), Welsh (47.0%, a difference of 0.080%), Immigrants from Asia (47.0%, a difference of 0.080%), Asian (46.9%, a difference of 0.090%), and Immigrants from Zaire (47.1%, a difference of 0.13%).
| Demographics | Rating | Rank | Disability Age Over 75 |
| Venezuelans | 85.0 /100 | #144 | Excellent 46.9% |
| Costa Ricans | 84.5 /100 | #145 | Excellent 46.9% |
| Guyanese | 84.3 /100 | #146 | Excellent 46.9% |
| Immigrants | Peru | 84.1 /100 | #147 | Excellent 46.9% |
| Asians | 81.6 /100 | #148 | Excellent 46.9% |
| Welsh | 81.3 /100 | #149 | Excellent 47.0% |
| Immigrants | Russia | 79.3 /100 | #150 | Good 47.0% |
| French Canadians | 79.0 /100 | #151 | Good 47.0% |
| Immigrants | Asia | 76.5 /100 | #152 | Good 47.0% |
| Immigrants | Zaire | 74.8 /100 | #153 | Good 47.1% |
| Immigrants | Belarus | 74.8 /100 | #154 | Good 47.1% |
| Immigrants | Iran | 74.7 /100 | #155 | Good 47.1% |
| Arabs | 73.3 /100 | #156 | Good 47.1% |
| Bhutanese | 72.6 /100 | #157 | Good 47.1% |
| Immigrants | Guyana | 71.9 /100 | #158 | Good 47.1% |