Tlingit-Haida vs Slovak Disability Age Over 75
COMPARE
Tlingit-Haida
Slovak
Disability Age Over 75
Disability Age Over 75 Comparison
Tlingit-Haida
Slovaks
50.6%
DISABILITY AGE OVER 75
0.0/ 100
METRIC RATING
310th/ 347
METRIC RANK
45.8%
DISABILITY AGE OVER 75
99.6/ 100
METRIC RATING
54th/ 347
METRIC RANK
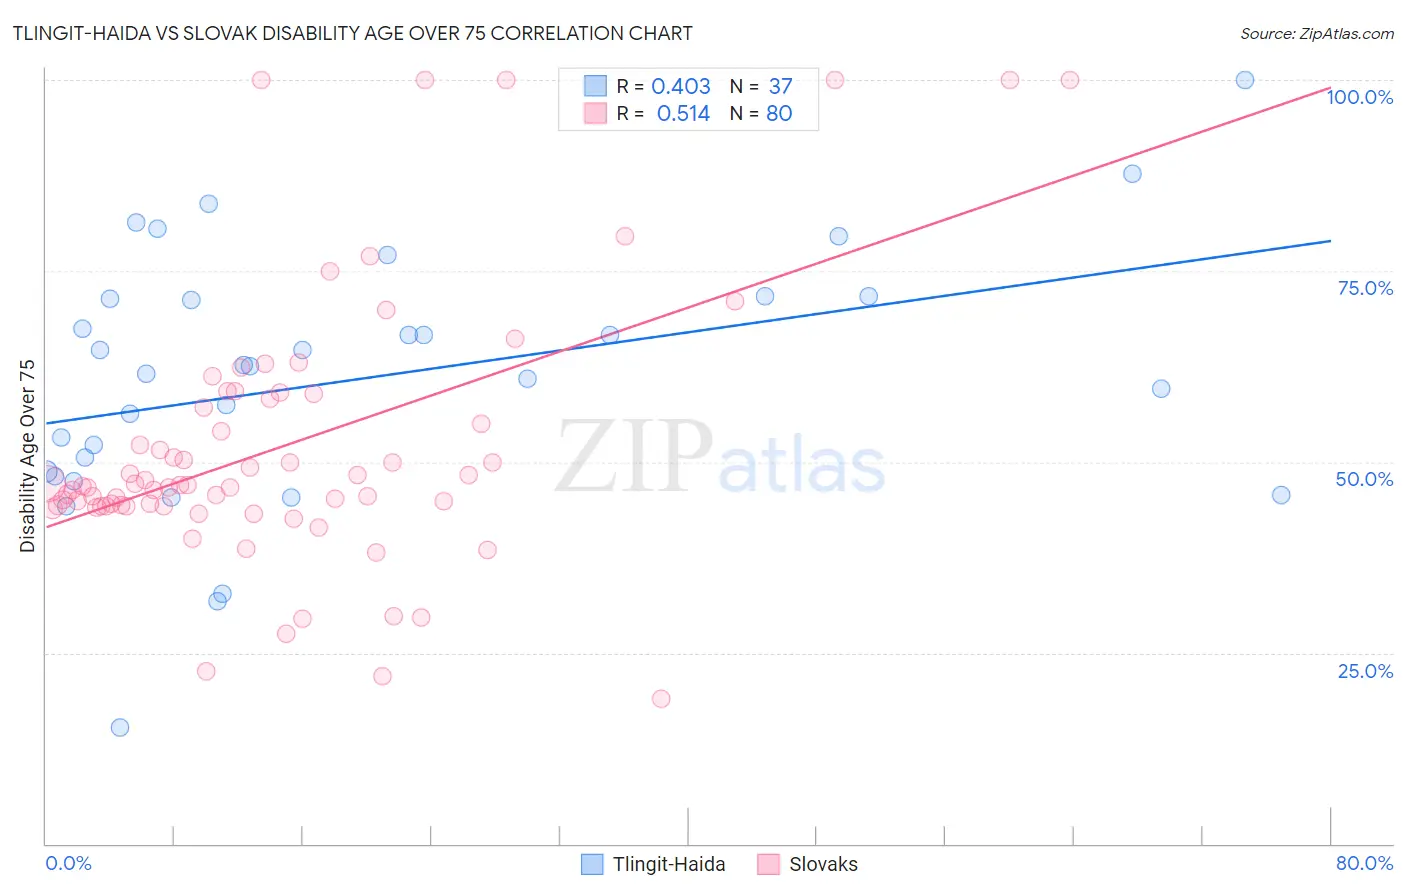
Tlingit-Haida vs Slovak Disability Age Over 75 Correlation Chart
The statistical analysis conducted on geographies consisting of 60,768,842 people shows a moderate positive correlation between the proportion of Tlingit-Haida and percentage of population with a disability over the age of 75 in the United States with a correlation coefficient (R) of 0.403 and weighted average of 50.6%. Similarly, the statistical analysis conducted on geographies consisting of 397,228,440 people shows a substantial positive correlation between the proportion of Slovaks and percentage of population with a disability over the age of 75 in the United States with a correlation coefficient (R) of 0.514 and weighted average of 45.8%, a difference of 10.4%.
Disability Age Over 75 Correlation Summary
| Measurement | Tlingit-Haida | Slovak |
| Minimum | 15.2% | 19.0% |
| Maximum | 100.0% | 100.0% |
| Range | 84.8% | 81.0% |
| Mean | 60.9% | 52.1% |
| Median | 62.5% | 46.9% |
| Interquartile 25% (IQ1) | 48.4% | 44.2% |
| Interquartile 75% (IQ3) | 71.5% | 58.6% |
| Interquartile Range (IQR) | 23.0% | 14.4% |
| Standard Deviation (Sample) | 16.9% | 17.7% |
| Standard Deviation (Population) | 16.7% | 17.6% |
Similar Demographics by Disability Age Over 75
Demographics Similar to Tlingit-Haida by Disability Age Over 75
In terms of disability age over 75, the demographic groups most similar to Tlingit-Haida are Hispanic or Latino (50.6%, a difference of 0.040%), Aleut (50.6%, a difference of 0.040%), Immigrants from Fiji (50.6%, a difference of 0.070%), Cajun (50.7%, a difference of 0.10%), and Immigrants from Central America (50.5%, a difference of 0.12%).
| Demographics | Rating | Rank | Disability Age Over 75 |
| Japanese | 0.0 /100 | #303 | Tragic 50.2% |
| Immigrants | Dominican Republic | 0.0 /100 | #304 | Tragic 50.3% |
| Central American Indians | 0.0 /100 | #305 | Tragic 50.5% |
| Immigrants | Central America | 0.0 /100 | #306 | Tragic 50.5% |
| Immigrants | Fiji | 0.0 /100 | #307 | Tragic 50.6% |
| Hispanics or Latinos | 0.0 /100 | #308 | Tragic 50.6% |
| Aleuts | 0.0 /100 | #309 | Tragic 50.6% |
| Tlingit-Haida | 0.0 /100 | #310 | Tragic 50.6% |
| Cajuns | 0.0 /100 | #311 | Tragic 50.7% |
| Cheyenne | 0.0 /100 | #312 | Tragic 50.9% |
| Immigrants | Azores | 0.0 /100 | #313 | Tragic 50.9% |
| Immigrants | Mexico | 0.0 /100 | #314 | Tragic 51.1% |
| Mexicans | 0.0 /100 | #315 | Tragic 51.1% |
| Chickasaw | 0.0 /100 | #316 | Tragic 51.2% |
| Yakama | 0.0 /100 | #317 | Tragic 51.3% |
Demographics Similar to Slovaks by Disability Age Over 75
In terms of disability age over 75, the demographic groups most similar to Slovaks are Maltese (45.8%, a difference of 0.0%), Immigrants from Netherlands (45.9%, a difference of 0.070%), Immigrants from Italy (45.8%, a difference of 0.080%), Immigrants from Turkey (45.9%, a difference of 0.080%), and Immigrants from France (45.8%, a difference of 0.090%).
| Demographics | Rating | Rank | Disability Age Over 75 |
| Immigrants | Canada | 99.8 /100 | #47 | Exceptional 45.7% |
| Croatians | 99.8 /100 | #48 | Exceptional 45.7% |
| Immigrants | North America | 99.8 /100 | #49 | Exceptional 45.7% |
| Belgians | 99.7 /100 | #50 | Exceptional 45.8% |
| Immigrants | Korea | 99.7 /100 | #51 | Exceptional 45.8% |
| Immigrants | France | 99.7 /100 | #52 | Exceptional 45.8% |
| Immigrants | Italy | 99.7 /100 | #53 | Exceptional 45.8% |
| Slovaks | 99.6 /100 | #54 | Exceptional 45.8% |
| Maltese | 99.6 /100 | #55 | Exceptional 45.8% |
| Immigrants | Netherlands | 99.6 /100 | #56 | Exceptional 45.9% |
| Immigrants | Turkey | 99.6 /100 | #57 | Exceptional 45.9% |
| Immigrants | Israel | 99.6 /100 | #58 | Exceptional 45.9% |
| Iranians | 99.6 /100 | #59 | Exceptional 45.9% |
| Immigrants | Europe | 99.6 /100 | #60 | Exceptional 45.9% |
| Immigrants | Argentina | 99.6 /100 | #61 | Exceptional 45.9% |