Tlingit-Haida vs Indonesian Disability Age Over 75
COMPARE
Tlingit-Haida
Indonesian
Disability Age Over 75
Disability Age Over 75 Comparison
Tlingit-Haida
Indonesians
50.6%
DISABILITY AGE OVER 75
0.0/ 100
METRIC RATING
310th/ 347
METRIC RANK
48.2%
DISABILITY AGE OVER 75
4.2/ 100
METRIC RATING
232nd/ 347
METRIC RANK
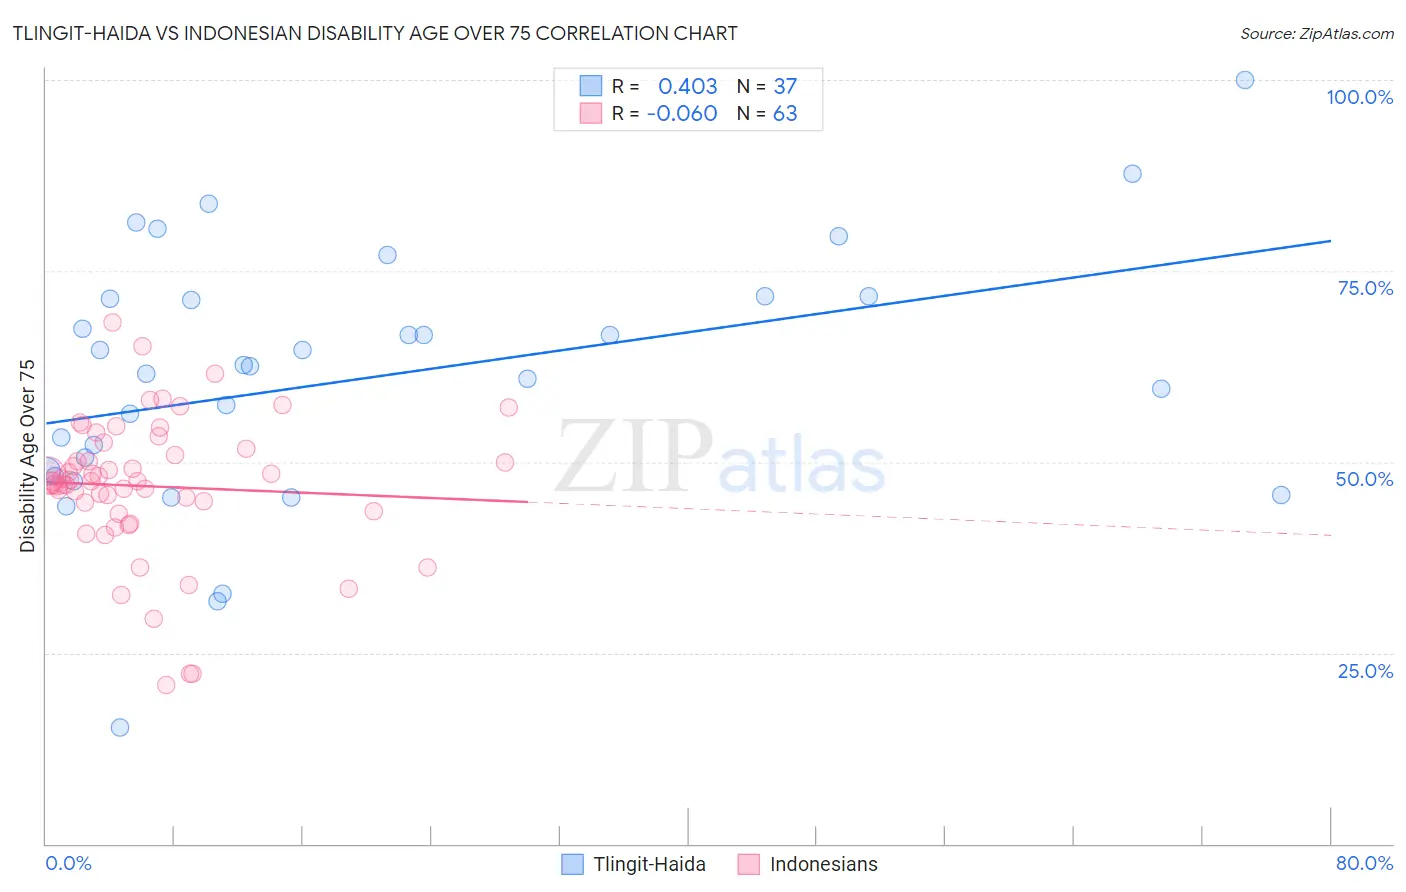
Tlingit-Haida vs Indonesian Disability Age Over 75 Correlation Chart
The statistical analysis conducted on geographies consisting of 60,768,842 people shows a moderate positive correlation between the proportion of Tlingit-Haida and percentage of population with a disability over the age of 75 in the United States with a correlation coefficient (R) of 0.403 and weighted average of 50.6%. Similarly, the statistical analysis conducted on geographies consisting of 162,478,519 people shows a slight negative correlation between the proportion of Indonesians and percentage of population with a disability over the age of 75 in the United States with a correlation coefficient (R) of -0.060 and weighted average of 48.2%, a difference of 5.1%.
Disability Age Over 75 Correlation Summary
| Measurement | Tlingit-Haida | Indonesian |
| Minimum | 15.2% | 20.8% |
| Maximum | 100.0% | 68.2% |
| Range | 84.8% | 47.4% |
| Mean | 60.9% | 46.8% |
| Median | 62.5% | 47.5% |
| Interquartile 25% (IQ1) | 48.4% | 43.5% |
| Interquartile 75% (IQ3) | 71.5% | 51.7% |
| Interquartile Range (IQR) | 23.0% | 8.3% |
| Standard Deviation (Sample) | 16.9% | 9.2% |
| Standard Deviation (Population) | 16.7% | 9.1% |
Similar Demographics by Disability Age Over 75
Demographics Similar to Tlingit-Haida by Disability Age Over 75
In terms of disability age over 75, the demographic groups most similar to Tlingit-Haida are Hispanic or Latino (50.6%, a difference of 0.040%), Aleut (50.6%, a difference of 0.040%), Immigrants from Fiji (50.6%, a difference of 0.070%), Cajun (50.7%, a difference of 0.10%), and Immigrants from Central America (50.5%, a difference of 0.12%).
| Demographics | Rating | Rank | Disability Age Over 75 |
| Japanese | 0.0 /100 | #303 | Tragic 50.2% |
| Immigrants | Dominican Republic | 0.0 /100 | #304 | Tragic 50.3% |
| Central American Indians | 0.0 /100 | #305 | Tragic 50.5% |
| Immigrants | Central America | 0.0 /100 | #306 | Tragic 50.5% |
| Immigrants | Fiji | 0.0 /100 | #307 | Tragic 50.6% |
| Hispanics or Latinos | 0.0 /100 | #308 | Tragic 50.6% |
| Aleuts | 0.0 /100 | #309 | Tragic 50.6% |
| Tlingit-Haida | 0.0 /100 | #310 | Tragic 50.6% |
| Cajuns | 0.0 /100 | #311 | Tragic 50.7% |
| Cheyenne | 0.0 /100 | #312 | Tragic 50.9% |
| Immigrants | Azores | 0.0 /100 | #313 | Tragic 50.9% |
| Immigrants | Mexico | 0.0 /100 | #314 | Tragic 51.1% |
| Mexicans | 0.0 /100 | #315 | Tragic 51.1% |
| Chickasaw | 0.0 /100 | #316 | Tragic 51.2% |
| Yakama | 0.0 /100 | #317 | Tragic 51.3% |
Demographics Similar to Indonesians by Disability Age Over 75
In terms of disability age over 75, the demographic groups most similar to Indonesians are Cree (48.2%, a difference of 0.0%), Immigrants (48.2%, a difference of 0.010%), Taiwanese (48.2%, a difference of 0.030%), Subsaharan African (48.2%, a difference of 0.060%), and Hmong (48.2%, a difference of 0.070%).
| Demographics | Rating | Rank | Disability Age Over 75 |
| Spanish | 6.5 /100 | #225 | Tragic 48.0% |
| Immigrants | Nonimmigrants | 6.5 /100 | #226 | Tragic 48.0% |
| Zimbabweans | 6.4 /100 | #227 | Tragic 48.1% |
| Immigrants | Liberia | 5.9 /100 | #228 | Tragic 48.1% |
| Spaniards | 5.7 /100 | #229 | Tragic 48.1% |
| Taiwanese | 4.4 /100 | #230 | Tragic 48.2% |
| Immigrants | Immigrants | 4.3 /100 | #231 | Tragic 48.2% |
| Indonesians | 4.2 /100 | #232 | Tragic 48.2% |
| Cree | 4.2 /100 | #233 | Tragic 48.2% |
| Sub-Saharan Africans | 3.8 /100 | #234 | Tragic 48.2% |
| Hmong | 3.8 /100 | #235 | Tragic 48.2% |
| Immigrants | Nicaragua | 3.2 /100 | #236 | Tragic 48.2% |
| Immigrants | St. Vincent and the Grenadines | 3.2 /100 | #237 | Tragic 48.2% |
| Nicaraguans | 3.0 /100 | #238 | Tragic 48.3% |
| Immigrants | Thailand | 2.8 /100 | #239 | Tragic 48.3% |