Tlingit-Haida vs Carpatho Rusyn Disability Age Over 75
COMPARE
Tlingit-Haida
Carpatho Rusyn
Disability Age Over 75
Disability Age Over 75 Comparison
Tlingit-Haida
Carpatho Rusyns
50.6%
DISABILITY AGE OVER 75
0.0/ 100
METRIC RATING
310th/ 347
METRIC RANK
44.8%
DISABILITY AGE OVER 75
100.0/ 100
METRIC RATING
4th/ 347
METRIC RANK
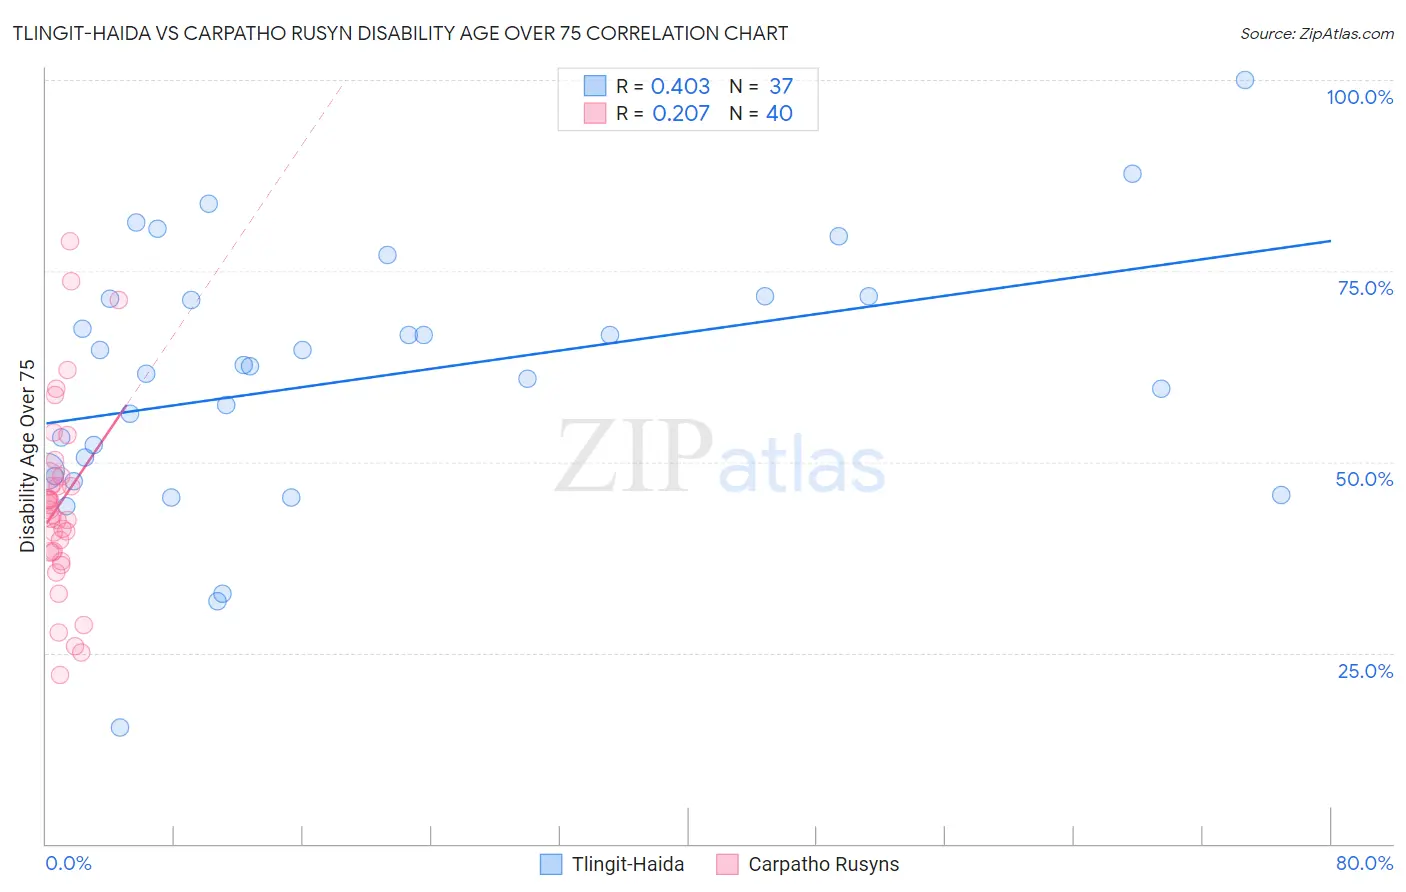
Tlingit-Haida vs Carpatho Rusyn Disability Age Over 75 Correlation Chart
The statistical analysis conducted on geographies consisting of 60,768,842 people shows a moderate positive correlation between the proportion of Tlingit-Haida and percentage of population with a disability over the age of 75 in the United States with a correlation coefficient (R) of 0.403 and weighted average of 50.6%. Similarly, the statistical analysis conducted on geographies consisting of 58,869,568 people shows a weak positive correlation between the proportion of Carpatho Rusyns and percentage of population with a disability over the age of 75 in the United States with a correlation coefficient (R) of 0.207 and weighted average of 44.8%, a difference of 12.9%.
Disability Age Over 75 Correlation Summary
| Measurement | Tlingit-Haida | Carpatho Rusyn |
| Minimum | 15.2% | 22.1% |
| Maximum | 100.0% | 78.8% |
| Range | 84.8% | 56.8% |
| Mean | 60.9% | 44.6% |
| Median | 62.5% | 43.3% |
| Interquartile 25% (IQ1) | 48.4% | 38.2% |
| Interquartile 75% (IQ3) | 71.5% | 48.0% |
| Interquartile Range (IQR) | 23.0% | 9.8% |
| Standard Deviation (Sample) | 16.9% | 12.4% |
| Standard Deviation (Population) | 16.7% | 12.3% |
Similar Demographics by Disability Age Over 75
Demographics Similar to Tlingit-Haida by Disability Age Over 75
In terms of disability age over 75, the demographic groups most similar to Tlingit-Haida are Hispanic or Latino (50.6%, a difference of 0.040%), Aleut (50.6%, a difference of 0.040%), Immigrants from Fiji (50.6%, a difference of 0.070%), Cajun (50.7%, a difference of 0.10%), and Immigrants from Central America (50.5%, a difference of 0.12%).
| Demographics | Rating | Rank | Disability Age Over 75 |
| Japanese | 0.0 /100 | #303 | Tragic 50.2% |
| Immigrants | Dominican Republic | 0.0 /100 | #304 | Tragic 50.3% |
| Central American Indians | 0.0 /100 | #305 | Tragic 50.5% |
| Immigrants | Central America | 0.0 /100 | #306 | Tragic 50.5% |
| Immigrants | Fiji | 0.0 /100 | #307 | Tragic 50.6% |
| Hispanics or Latinos | 0.0 /100 | #308 | Tragic 50.6% |
| Aleuts | 0.0 /100 | #309 | Tragic 50.6% |
| Tlingit-Haida | 0.0 /100 | #310 | Tragic 50.6% |
| Cajuns | 0.0 /100 | #311 | Tragic 50.7% |
| Cheyenne | 0.0 /100 | #312 | Tragic 50.9% |
| Immigrants | Azores | 0.0 /100 | #313 | Tragic 50.9% |
| Immigrants | Mexico | 0.0 /100 | #314 | Tragic 51.1% |
| Mexicans | 0.0 /100 | #315 | Tragic 51.1% |
| Chickasaw | 0.0 /100 | #316 | Tragic 51.2% |
| Yakama | 0.0 /100 | #317 | Tragic 51.3% |
Demographics Similar to Carpatho Rusyns by Disability Age Over 75
In terms of disability age over 75, the demographic groups most similar to Carpatho Rusyns are Eastern European (44.8%, a difference of 0.030%), Luxembourger (44.8%, a difference of 0.060%), Immigrants from Lithuania (44.9%, a difference of 0.15%), Okinawan (44.9%, a difference of 0.19%), and Immigrants from Austria (44.9%, a difference of 0.31%).
| Demographics | Rating | Rank | Disability Age Over 75 |
| Cypriots | 100.0 /100 | #1 | Exceptional 43.5% |
| Immigrants | Ireland | 100.0 /100 | #2 | Exceptional 44.7% |
| Eastern Europeans | 100.0 /100 | #3 | Exceptional 44.8% |
| Carpatho Rusyns | 100.0 /100 | #4 | Exceptional 44.8% |
| Luxembourgers | 100.0 /100 | #5 | Exceptional 44.8% |
| Immigrants | Lithuania | 100.0 /100 | #6 | Exceptional 44.9% |
| Okinawans | 100.0 /100 | #7 | Exceptional 44.9% |
| Immigrants | Austria | 100.0 /100 | #8 | Exceptional 44.9% |
| Paraguayans | 100.0 /100 | #9 | Exceptional 45.0% |
| Bulgarians | 100.0 /100 | #10 | Exceptional 45.1% |
| Lithuanians | 100.0 /100 | #11 | Exceptional 45.1% |
| Immigrants | Czechoslovakia | 100.0 /100 | #12 | Exceptional 45.1% |
| Latvians | 100.0 /100 | #13 | Exceptional 45.1% |
| Immigrants | Scotland | 100.0 /100 | #14 | Exceptional 45.1% |
| Immigrants | Sweden | 100.0 /100 | #15 | Exceptional 45.1% |