Tlingit-Haida vs Austrian Disability Age Over 75
COMPARE
Tlingit-Haida
Austrian
Disability Age Over 75
Disability Age Over 75 Comparison
Tlingit-Haida
Austrians
50.6%
DISABILITY AGE OVER 75
0.0/ 100
METRIC RATING
310th/ 347
METRIC RANK
46.0%
DISABILITY AGE OVER 75
99.5/ 100
METRIC RATING
65th/ 347
METRIC RANK
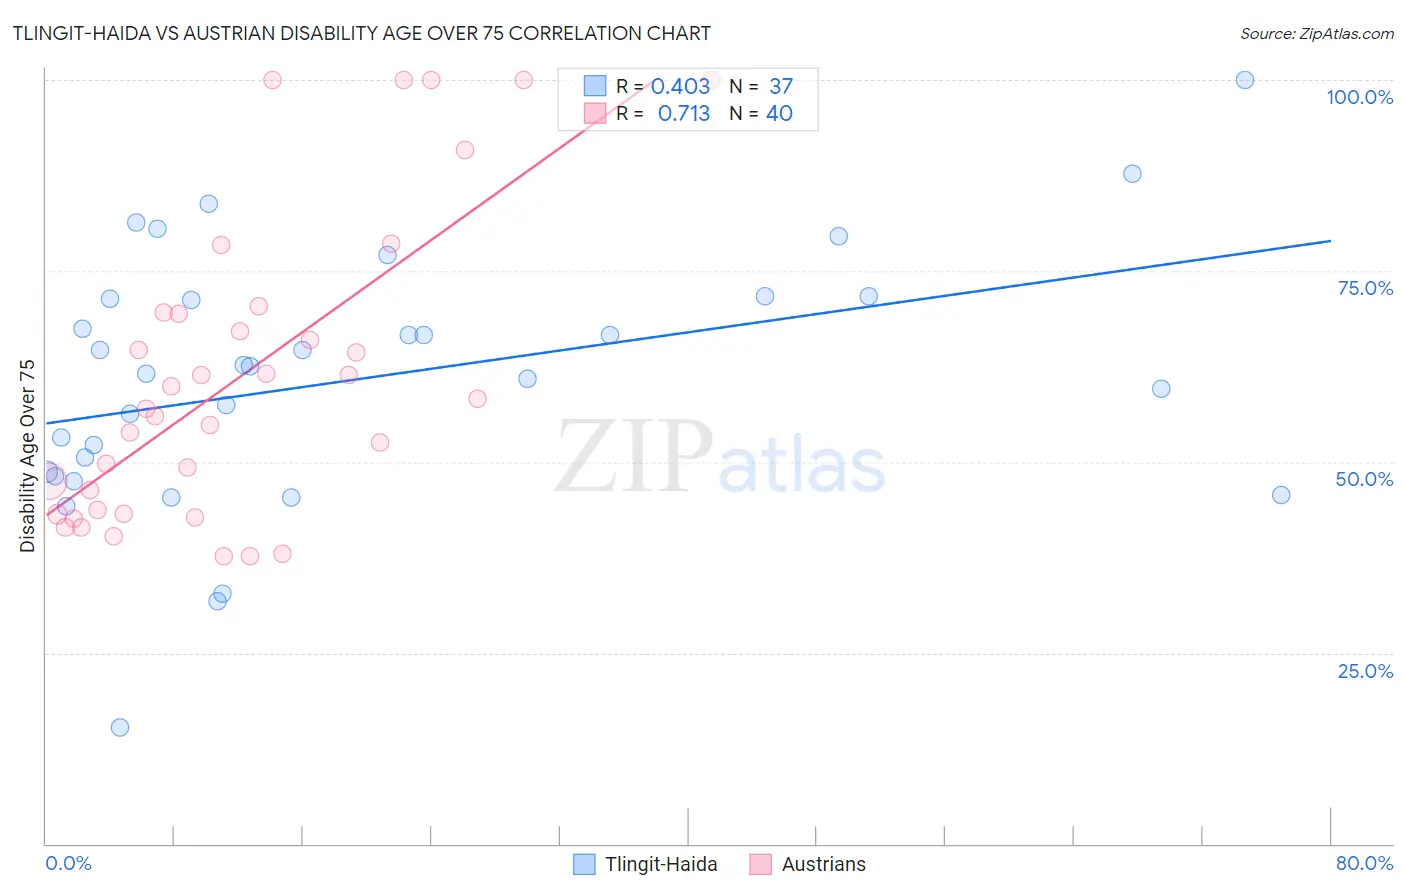
Tlingit-Haida vs Austrian Disability Age Over 75 Correlation Chart
The statistical analysis conducted on geographies consisting of 60,768,842 people shows a moderate positive correlation between the proportion of Tlingit-Haida and percentage of population with a disability over the age of 75 in the United States with a correlation coefficient (R) of 0.403 and weighted average of 50.6%. Similarly, the statistical analysis conducted on geographies consisting of 451,276,347 people shows a strong positive correlation between the proportion of Austrians and percentage of population with a disability over the age of 75 in the United States with a correlation coefficient (R) of 0.713 and weighted average of 46.0%, a difference of 10.1%.
Disability Age Over 75 Correlation Summary
| Measurement | Tlingit-Haida | Austrian |
| Minimum | 15.2% | 37.6% |
| Maximum | 100.0% | 100.0% |
| Range | 84.8% | 62.4% |
| Mean | 60.9% | 61.0% |
| Median | 62.5% | 57.6% |
| Interquartile 25% (IQ1) | 48.4% | 43.5% |
| Interquartile 75% (IQ3) | 71.5% | 69.5% |
| Interquartile Range (IQR) | 23.0% | 26.0% |
| Standard Deviation (Sample) | 16.9% | 19.4% |
| Standard Deviation (Population) | 16.7% | 19.2% |
Similar Demographics by Disability Age Over 75
Demographics Similar to Tlingit-Haida by Disability Age Over 75
In terms of disability age over 75, the demographic groups most similar to Tlingit-Haida are Hispanic or Latino (50.6%, a difference of 0.040%), Aleut (50.6%, a difference of 0.040%), Immigrants from Fiji (50.6%, a difference of 0.070%), Cajun (50.7%, a difference of 0.10%), and Immigrants from Central America (50.5%, a difference of 0.12%).
| Demographics | Rating | Rank | Disability Age Over 75 |
| Japanese | 0.0 /100 | #303 | Tragic 50.2% |
| Immigrants | Dominican Republic | 0.0 /100 | #304 | Tragic 50.3% |
| Central American Indians | 0.0 /100 | #305 | Tragic 50.5% |
| Immigrants | Central America | 0.0 /100 | #306 | Tragic 50.5% |
| Immigrants | Fiji | 0.0 /100 | #307 | Tragic 50.6% |
| Hispanics or Latinos | 0.0 /100 | #308 | Tragic 50.6% |
| Aleuts | 0.0 /100 | #309 | Tragic 50.6% |
| Tlingit-Haida | 0.0 /100 | #310 | Tragic 50.6% |
| Cajuns | 0.0 /100 | #311 | Tragic 50.7% |
| Cheyenne | 0.0 /100 | #312 | Tragic 50.9% |
| Immigrants | Azores | 0.0 /100 | #313 | Tragic 50.9% |
| Immigrants | Mexico | 0.0 /100 | #314 | Tragic 51.1% |
| Mexicans | 0.0 /100 | #315 | Tragic 51.1% |
| Chickasaw | 0.0 /100 | #316 | Tragic 51.2% |
| Yakama | 0.0 /100 | #317 | Tragic 51.3% |
Demographics Similar to Austrians by Disability Age Over 75
In terms of disability age over 75, the demographic groups most similar to Austrians are Immigrants from England (46.0%, a difference of 0.010%), Immigrants from North Macedonia (45.9%, a difference of 0.030%), Immigrants from Norway (45.9%, a difference of 0.040%), Immigrants from Spain (46.0%, a difference of 0.040%), and Immigrants from South Central Asia (46.0%, a difference of 0.070%).
| Demographics | Rating | Rank | Disability Age Over 75 |
| Immigrants | Israel | 99.6 /100 | #58 | Exceptional 45.9% |
| Iranians | 99.6 /100 | #59 | Exceptional 45.9% |
| Immigrants | Europe | 99.6 /100 | #60 | Exceptional 45.9% |
| Immigrants | Argentina | 99.6 /100 | #61 | Exceptional 45.9% |
| Burmese | 99.5 /100 | #62 | Exceptional 45.9% |
| Immigrants | Norway | 99.5 /100 | #63 | Exceptional 45.9% |
| Immigrants | North Macedonia | 99.5 /100 | #64 | Exceptional 45.9% |
| Austrians | 99.5 /100 | #65 | Exceptional 46.0% |
| Immigrants | England | 99.5 /100 | #66 | Exceptional 46.0% |
| Immigrants | Spain | 99.4 /100 | #67 | Exceptional 46.0% |
| Immigrants | South Central Asia | 99.4 /100 | #68 | Exceptional 46.0% |
| Immigrants | Romania | 99.3 /100 | #69 | Exceptional 46.0% |
| Jordanians | 99.2 /100 | #70 | Exceptional 46.1% |
| Immigrants | Sri Lanka | 99.2 /100 | #71 | Exceptional 46.1% |
| Immigrants | Hungary | 99.1 /100 | #72 | Exceptional 46.1% |