Tlingit-Haida vs Somali Disability Age Over 75
COMPARE
Tlingit-Haida
Somali
Disability Age Over 75
Disability Age Over 75 Comparison
Tlingit-Haida
Somalis
50.6%
DISABILITY AGE OVER 75
0.0/ 100
METRIC RATING
310th/ 347
METRIC RANK
47.6%
DISABILITY AGE OVER 75
29.5/ 100
METRIC RATING
190th/ 347
METRIC RANK
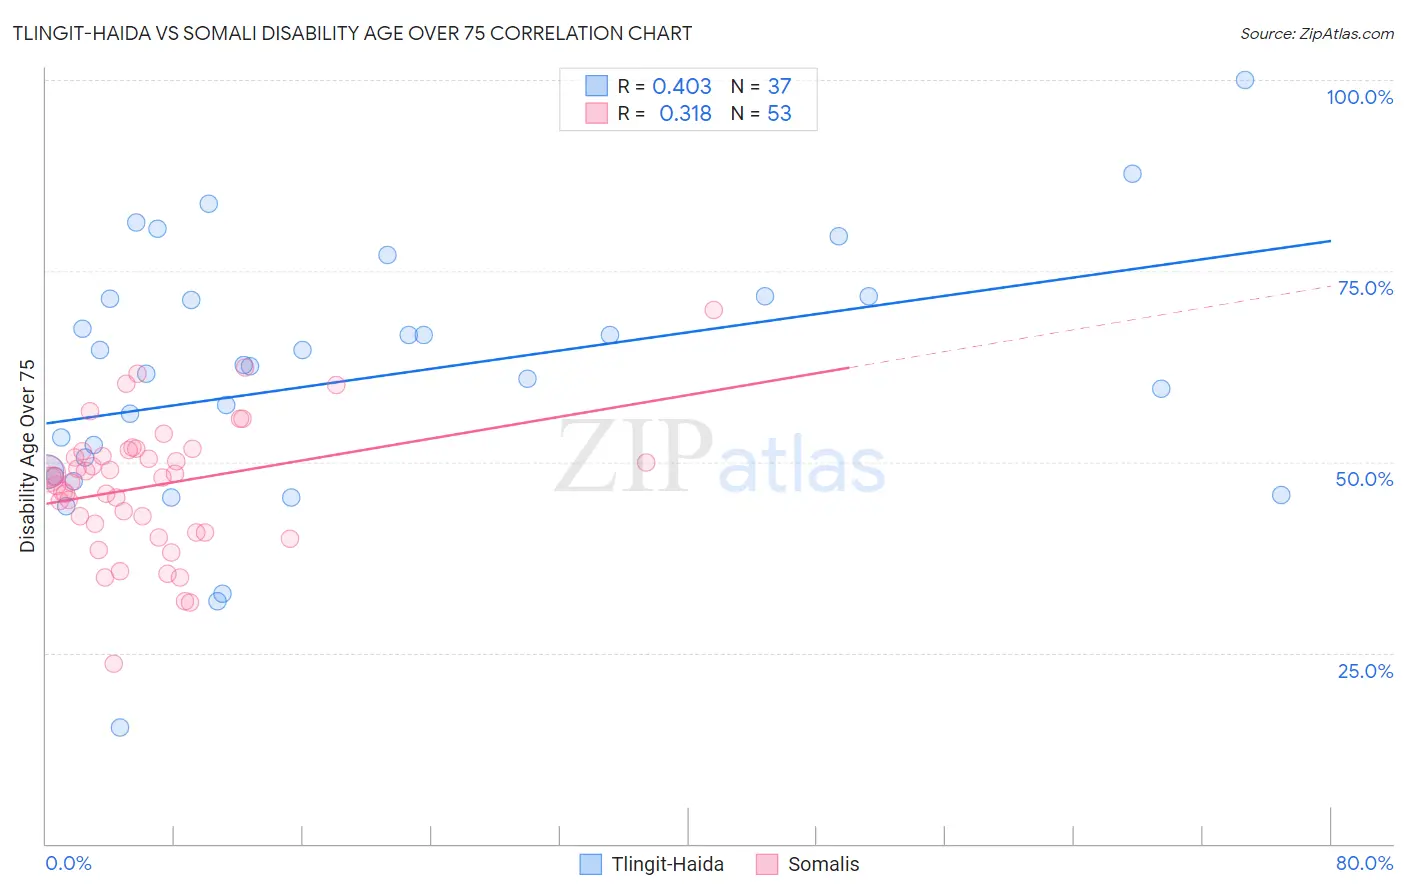
Tlingit-Haida vs Somali Disability Age Over 75 Correlation Chart
The statistical analysis conducted on geographies consisting of 60,768,842 people shows a moderate positive correlation between the proportion of Tlingit-Haida and percentage of population with a disability over the age of 75 in the United States with a correlation coefficient (R) of 0.403 and weighted average of 50.6%. Similarly, the statistical analysis conducted on geographies consisting of 99,187,417 people shows a mild positive correlation between the proportion of Somalis and percentage of population with a disability over the age of 75 in the United States with a correlation coefficient (R) of 0.318 and weighted average of 47.6%, a difference of 6.4%.
Disability Age Over 75 Correlation Summary
| Measurement | Tlingit-Haida | Somali |
| Minimum | 15.2% | 23.5% |
| Maximum | 100.0% | 69.9% |
| Range | 84.8% | 46.4% |
| Mean | 60.9% | 46.9% |
| Median | 62.5% | 48.0% |
| Interquartile 25% (IQ1) | 48.4% | 41.4% |
| Interquartile 75% (IQ3) | 71.5% | 51.5% |
| Interquartile Range (IQR) | 23.0% | 10.1% |
| Standard Deviation (Sample) | 16.9% | 8.5% |
| Standard Deviation (Population) | 16.7% | 8.5% |
Similar Demographics by Disability Age Over 75
Demographics Similar to Tlingit-Haida by Disability Age Over 75
In terms of disability age over 75, the demographic groups most similar to Tlingit-Haida are Hispanic or Latino (50.6%, a difference of 0.040%), Aleut (50.6%, a difference of 0.040%), Immigrants from Fiji (50.6%, a difference of 0.070%), Cajun (50.7%, a difference of 0.10%), and Immigrants from Central America (50.5%, a difference of 0.12%).
| Demographics | Rating | Rank | Disability Age Over 75 |
| Japanese | 0.0 /100 | #303 | Tragic 50.2% |
| Immigrants | Dominican Republic | 0.0 /100 | #304 | Tragic 50.3% |
| Central American Indians | 0.0 /100 | #305 | Tragic 50.5% |
| Immigrants | Central America | 0.0 /100 | #306 | Tragic 50.5% |
| Immigrants | Fiji | 0.0 /100 | #307 | Tragic 50.6% |
| Hispanics or Latinos | 0.0 /100 | #308 | Tragic 50.6% |
| Aleuts | 0.0 /100 | #309 | Tragic 50.6% |
| Tlingit-Haida | 0.0 /100 | #310 | Tragic 50.6% |
| Cajuns | 0.0 /100 | #311 | Tragic 50.7% |
| Cheyenne | 0.0 /100 | #312 | Tragic 50.9% |
| Immigrants | Azores | 0.0 /100 | #313 | Tragic 50.9% |
| Immigrants | Mexico | 0.0 /100 | #314 | Tragic 51.1% |
| Mexicans | 0.0 /100 | #315 | Tragic 51.1% |
| Chickasaw | 0.0 /100 | #316 | Tragic 51.2% |
| Yakama | 0.0 /100 | #317 | Tragic 51.3% |
Demographics Similar to Somalis by Disability Age Over 75
In terms of disability age over 75, the demographic groups most similar to Somalis are Portuguese (47.6%, a difference of 0.010%), Immigrants from Jamaica (47.6%, a difference of 0.030%), Basque (47.6%, a difference of 0.040%), Immigrants from Kenya (47.6%, a difference of 0.040%), and Ottawa (47.6%, a difference of 0.040%).
| Demographics | Rating | Rank | Disability Age Over 75 |
| Delaware | 39.1 /100 | #183 | Fair 47.5% |
| Immigrants | Nigeria | 34.0 /100 | #184 | Fair 47.5% |
| Ghanaians | 33.0 /100 | #185 | Fair 47.5% |
| Sudanese | 32.0 /100 | #186 | Fair 47.5% |
| Immigrants | Sudan | 31.8 /100 | #187 | Fair 47.5% |
| Basques | 30.9 /100 | #188 | Fair 47.6% |
| Immigrants | Kenya | 30.8 /100 | #189 | Fair 47.6% |
| Somalis | 29.5 /100 | #190 | Fair 47.6% |
| Portuguese | 29.3 /100 | #191 | Fair 47.6% |
| Immigrants | Jamaica | 28.3 /100 | #192 | Fair 47.6% |
| Ottawa | 28.1 /100 | #193 | Fair 47.6% |
| Immigrants | Lebanon | 26.5 /100 | #194 | Fair 47.6% |
| Immigrants | Trinidad and Tobago | 25.3 /100 | #195 | Fair 47.6% |
| Immigrants | Portugal | 23.8 /100 | #196 | Fair 47.6% |
| Pakistanis | 23.4 /100 | #197 | Fair 47.7% |