Tlingit-Haida vs Immigrants from Ethiopia Disability Age Over 75

COMPARE

Tlingit-Haida
Race
Ancestry
AfghanAfricanAlaska NativeAlaskan AthabascanAlbanianAleutAlsatianAmericanApacheArabArapahoArgentineanArmenianAssyrian/Chaldean/SyriacAustralianAustrianBahamianBangladeshiBarbadianBasqueBelgianBelizeanBermudanBhutaneseBlackfeetBolivianBrazilianBritishBritish West IndianBulgarianBurmeseCajunCambodianCanadianCape VerdeanCarpatho RusynCelticCentral AmericanCentral American IndianCherokeeCheyenneChickasawChileanChineseChippewaChoctawColombianColvilleComancheCosta RicanCreeCreekCroatianCrowCubanCypriotCzechCzechoslovakianDanishDelawareDominicanDutchDutch West IndianEastern EuropeanEcuadorianEgyptianEnglishEstonianEthiopianEuropeanFijianFilipinoFinnishFrenchFrench American IndianFrench CanadianGermanGerman RussianGhanaianGreekGuamanian/ChamorroGuatemalanGuyaneseHaitianHmongHonduranHopiHoumaHungarianIcelanderIndian (Asian)IndonesianInupiatIranianIraqiIrishIroquoisIsraeliItalianJamaicanJapaneseJordanianKenyanKiowaKoreanLaotianLatvianLebaneseLiberianLithuanianLumbeeLuxembourgerMacedonianMalaysianMalteseMarshalleseMenomineeMexicanMexican American IndianMongolianMoroccanNative HawaiianNavajoNepaleseNew ZealanderNicaraguanNigerianNorthern EuropeanNorwegianOkinawanOsageOttawaPaiutePakistaniPalestinianPanamanianParaguayanPennsylvania GermanPeruvianPimaPolishPortuguesePotawatomiPuebloPuerto RicanPuget Sound SalishRomanianRussianSalvadoranSamoanScandinavianScotch-IrishScottishSeminoleSenegaleseSerbianShoshoneSierra LeoneanSiouxSlavicSlovakSloveneSomaliSouth AfricanSouth AmericanSouth American IndianSoviet UnionSpaniardSpanishSpanish AmericanSpanish American IndianSri LankanSubsaharan AfricanSudaneseSwedishSwissSyrianTaiwaneseThaiTlingit-HaidaTohono O'OdhamTonganTrinidadian and TobagonianTsimshianTurkishU.S. Virgin IslanderUgandanUkrainianUruguayanUteVenezuelanVietnameseWelshWest IndianYakamaYaquiYugoslavianYumanYup'ikZimbabwean
Immigration
NonimmigrantsImmigrantsAfghanistanAfricaAlbaniaArgentinaArmeniaAsiaAustraliaAustriaBahamasBangladeshBarbadosBelarusBelgiumBelizeBoliviaBosnia and HerzegovinaBrazilBulgariaBurma/MyanmarCabo VerdeCambodiaCameroonCanadaCaribbeanCentral AmericaChileChinaColombiaCongoCosta RicaCroatiaCubaCzechoslovakiaDenmarkDominicaDominican RepublicEastern AfricaEastern AsiaEastern EuropeEcuadorEgyptEl SalvadorEnglandEritreaEuropeFijiFranceGermanyGhanaGreeceGrenadaGuatemalaGuyanaHaitiHondurasHong KongHungaryIndiaIndonesiaIranIraqIrelandIsraelItalyJamaicaJapanJordanKazakhstanKenyaKoreaKuwaitLaosLatin AmericaLatviaLebanonLiberiaLithuaniaMalaysiaMexicoMicronesiaMiddle AfricaMoldovaMoroccoNepalNetherlandsNicaraguaNigeriaNorth AmericaNorth MacedoniaNorthern AfricaNorthern EuropeNorwayOceaniaPakistanPanamaPeruPhilippinesPolandPortugalRomaniaRussiaSaudi ArabiaScotlandSenegalSerbiaSierra LeoneSingaporeSomaliaSouth AfricaSouth AmericaSouth Central AsiaSouth Eastern AsiaSouthern EuropeSpainSri LankaSt. Vincent and the GrenadinesSudanSwedenSwitzerlandSyriaTaiwanThailandTrinidad and TobagoTurkeyUgandaUkraineUruguayUzbekistanVenezuelaVietnamWest IndiesWestern AfricaWestern AsiaWestern EuropeYemenZaireZimbabweAzores
Immigrants from Ethiopia
Race
Ancestry
AfghanAfricanAlaska NativeAlaskan AthabascanAlbanianAleutAlsatianAmericanApacheArabArapahoArgentineanArmenianAssyrian/Chaldean/SyriacAustralianAustrianBahamianBangladeshiBarbadianBasqueBelgianBelizeanBermudanBhutaneseBlackfeetBolivianBrazilianBritishBritish West IndianBulgarianBurmeseCajunCambodianCanadianCape VerdeanCarpatho RusynCelticCentral AmericanCentral American IndianCherokeeCheyenneChickasawChileanChineseChippewaChoctawColombianColvilleComancheCosta RicanCreeCreekCroatianCrowCubanCypriotCzechCzechoslovakianDanishDelawareDominicanDutchDutch West IndianEastern EuropeanEcuadorianEgyptianEnglishEstonianEthiopianEuropeanFijianFilipinoFinnishFrenchFrench American IndianFrench CanadianGermanGerman RussianGhanaianGreekGuamanian/ChamorroGuatemalanGuyaneseHaitianHmongHonduranHopiHoumaHungarianIcelanderIndian (Asian)IndonesianInupiatIranianIraqiIrishIroquoisIsraeliItalianJamaicanJapaneseJordanianKenyanKiowaKoreanLaotianLatvianLebaneseLiberianLithuanianLumbeeLuxembourgerMacedonianMalaysianMalteseMarshalleseMenomineeMexicanMexican American IndianMongolianMoroccanNative HawaiianNavajoNepaleseNew ZealanderNicaraguanNigerianNorthern EuropeanNorwegianOkinawanOsageOttawaPaiutePakistaniPalestinianPanamanianParaguayanPennsylvania GermanPeruvianPimaPolishPortuguesePotawatomiPuebloPuerto RicanPuget Sound SalishRomanianRussianSalvadoranSamoanScandinavianScotch-IrishScottishSeminoleSenegaleseSerbianShoshoneSierra LeoneanSiouxSlavicSlovakSloveneSomaliSouth AfricanSouth AmericanSouth American IndianSoviet UnionSpaniardSpanishSpanish AmericanSpanish American IndianSri LankanSubsaharan AfricanSudaneseSwedishSwissSyrianTaiwaneseThaiTohono O'OdhamTonganTrinidadian and TobagonianTsimshianTurkishU.S. Virgin IslanderUgandanUkrainianUruguayanUteVenezuelanVietnameseWelshWest IndianYakamaYaquiYugoslavianYumanYup'ikZimbabwean
Immigration
NonimmigrantsImmigrantsAfghanistanAfricaAlbaniaArgentinaArmeniaAsiaAustraliaAustriaBahamasBangladeshBarbadosBelarusBelgiumBelizeBoliviaBosnia and HerzegovinaBrazilBulgariaBurma/MyanmarCabo VerdeCambodiaCameroonCanadaCaribbeanCentral AmericaChileChinaColombiaCongoCosta RicaCroatiaCubaCzechoslovakiaDenmarkDominicaDominican RepublicEastern AfricaEastern AsiaEastern EuropeEcuadorEgyptEl SalvadorEnglandEritreaEthiopiaEuropeFijiFranceGermanyGhanaGreeceGrenadaGuatemalaGuyanaHaitiHondurasHong KongHungaryIndiaIndonesiaIranIraqIrelandIsraelItalyJamaicaJapanJordanKazakhstanKenyaKoreaKuwaitLaosLatin AmericaLatviaLebanonLiberiaLithuaniaMalaysiaMexicoMicronesiaMiddle AfricaMoldovaMoroccoNepalNetherlandsNicaraguaNigeriaNorth AmericaNorth MacedoniaNorthern AfricaNorthern EuropeNorwayOceaniaPakistanPanamaPeruPhilippinesPolandPortugalRomaniaRussiaSaudi ArabiaScotlandSenegalSerbiaSierra LeoneSingaporeSomaliaSouth AfricaSouth AmericaSouth Central AsiaSouth Eastern AsiaSouthern EuropeSpainSri LankaSt. Vincent and the GrenadinesSudanSwedenSwitzerlandSyriaTaiwanThailandTrinidad and TobagoTurkeyUgandaUkraineUruguayUzbekistanVenezuelaVietnamWest IndiesWestern AfricaWestern AsiaWestern EuropeYemenZaireZimbabweAzores
Disability Age Over 75
Income
Poverty
Unemployment
Labor Participation
Family Structure
Vehicle Availability
Education Level
Disability

Disability Age Over 75 Comparison

Tlingit-Haida

Immigrants from Ethiopia

Tragic
Excellent
50.6%
DISABILITY AGE OVER 75
0.0/ 100
METRIC RATING
310th/ 347
METRIC RANK
46.8%
DISABILITY AGE OVER 75
89.1/ 100
METRIC RATING
134th/ 347
METRIC RANK

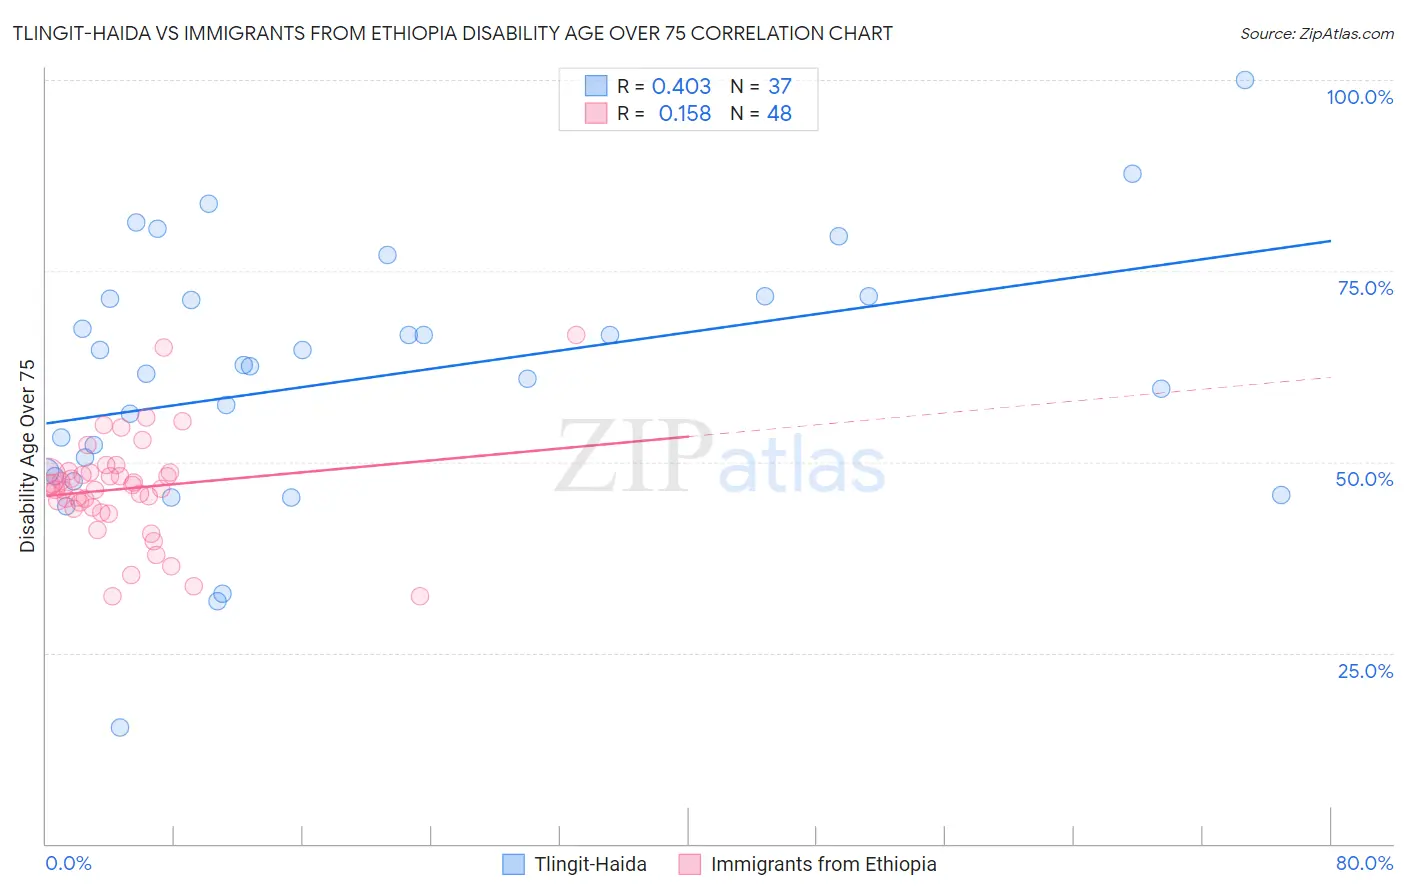
Tlingit-Haida vs Immigrants from Ethiopia Disability Age Over 75 Correlation Chart

The statistical analysis conducted on geographies consisting of 60,768,842 people shows a moderate positive correlation between the proportion of Tlingit-Haida and percentage of population with a disability over the age of 75 in the United States with a correlation coefficient (R) of 0.403 and weighted average of 50.6%. Similarly, the statistical analysis conducted on geographies consisting of 211,333,041 people shows a poor positive correlation between the proportion of Immigrants from Ethiopia and percentage of population with a disability over the age of 75 in the United States with a correlation coefficient (R) of 0.158 and weighted average of 46.8%, a difference of 8.2%.
Tlingit-Haida vs Immigrants from Ethiopia Disability Age Over 75

Disability Age Over 75 Correlation Summary

MeasurementTlingit-HaidaImmigrants from Ethiopia
Minimum15.2%32.4%
Maximum100.0%66.7%
Range84.8%34.3%
Mean60.9%46.5%
Median62.5%46.7%
Interquartile 25% (IQ1)48.4%43.9%
Interquartile 75% (IQ3)71.5%48.6%
Interquartile Range (IQR)23.0%4.7%
Standard Deviation (Sample)16.9%6.8%
Standard Deviation (Population)16.7%6.8%

Similar Demographics by Disability Age Over 75

Demographics Similar to Tlingit-Haida by Disability Age Over 75

In terms of disability age over 75, the demographic groups most similar to Tlingit-Haida are Hispanic or Latino (50.6%, a difference of 0.040%), Aleut (50.6%, a difference of 0.040%), Immigrants from Fiji (50.6%, a difference of 0.070%), Cajun (50.7%, a difference of 0.10%), and Immigrants from Central America (50.5%, a difference of 0.12%).
DemographicsRating | RankDisability Age Over 75
Japanese
0.0
/100
|
#303
Tragic
50.2%
Immigrants | Dominican Republic
0.0
/100
|
#304
Tragic
50.3%
Central American Indians
0.0
/100
|
#305
Tragic
50.5%
Immigrants | Central America
0.0
/100
|
#306
Tragic
50.5%
Immigrants | Fiji
0.0
/100
|
#307
Tragic
50.6%
Hispanics or Latinos
0.0
/100
|
#308
Tragic
50.6%
Aleuts
0.0
/100
|
#309
Tragic
50.6%
Tlingit-Haida
0.0
/100
|
#310
Tragic
50.6%
Cajuns
0.0
/100
|
#311
Tragic
50.7%
Cheyenne
0.0
/100
|
#312
Tragic
50.9%
Immigrants | Azores
0.0
/100
|
#313
Tragic
50.9%
Immigrants | Mexico
0.0
/100
|
#314
Tragic
51.1%
Mexicans
0.0
/100
|
#315
Tragic
51.1%
Chickasaw
0.0
/100
|
#316
Tragic
51.2%
Yakama
0.0
/100
|
#317
Tragic
51.3%

Demographics Similar to Immigrants from Ethiopia by Disability Age Over 75

In terms of disability age over 75, the demographic groups most similar to Immigrants from Ethiopia are Ethiopian (46.8%, a difference of 0.010%), English (46.8%, a difference of 0.020%), Immigrants from Venezuela (46.8%, a difference of 0.030%), Immigrants from Uganda (46.8%, a difference of 0.030%), and Immigrants from Bosnia and Herzegovina (46.8%, a difference of 0.040%).
DemographicsRating | RankDisability Age Over 75
Syrians
91.1
/100
|
#127
Exceptional
46.7%
Icelanders
90.9
/100
|
#128
Exceptional
46.7%
Immigrants | Germany
90.8
/100
|
#129
Exceptional
46.7%
Immigrants | Northern Africa
90.7
/100
|
#130
Exceptional
46.7%
Scottish
90.5
/100
|
#131
Exceptional
46.7%
South Americans
90.0
/100
|
#132
Excellent
46.8%
English
89.4
/100
|
#133
Excellent
46.8%
Immigrants | Ethiopia
89.1
/100
|
#134
Excellent
46.8%
Ethiopians
88.9
/100
|
#135
Excellent
46.8%
Immigrants | Venezuela
88.6
/100
|
#136
Excellent
46.8%
Immigrants | Uganda
88.5
/100
|
#137
Excellent
46.8%
Immigrants | Bosnia and Herzegovina
88.5
/100
|
#138
Excellent
46.8%
Yugoslavians
88.5
/100
|
#139
Excellent
46.8%
Immigrants | Costa Rica
87.4
/100
|
#140
Excellent
46.8%
Lebanese
87.0
/100
|
#141
Excellent
46.8%